


You are now leaving our website and entering a third-party website over which we have no control.

OUR STRATEGY
Proven Business Model
We are deeply committed to sustaining the trust of those we serve.
TD’s Premium Retail Earnings Mix2
TD Cowen adds strength and reach to TD Securities
DIVIDEND HISTORY

Championing our Brand
In a testament to the strength of our business and the goodwill of our brand, TD earned the #1 spot in Brand Finance’s 2023 Canada 100 Report, which ranks the 100 most valuable brands in Canada. Throughout the communities we serve, the green TD shield shines bright.
-

Marked the opening of TD Music Hall in Toronto’s historic Massey Hall concert venue.
-

Debuted the TD shield on the Toronto Blue Jays’ iconic jersey.
-

Extended our sponsorship with TD Garden and the Boston Bruins through to 2045.
-
NET INCOME
available to common shareholders (millions of Canadian dollars)
Reported Adjusted1

TD’s 5-year CAGR
-1.7% Reported
4.2% Adjusted1
-
DILUTED EARNINGS PER SHARE (EPS)
(Canadian dollars)
Reported Adjusted1

TD’s 5-year CAGR
-1.4% Reported
4.3% Adjusted1
-
RETURN ON COMMON EQUITY4
(percent)
Reported Adjusted1
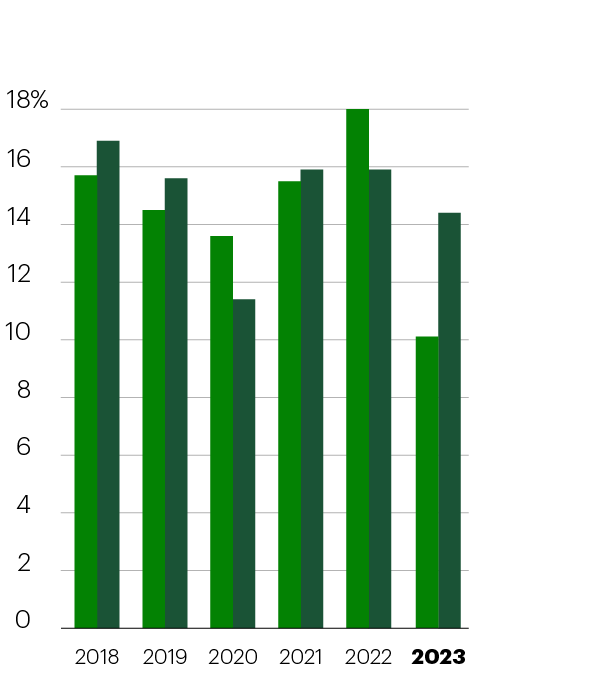
TD’s 2023 ROE
10.1% Reported
14.4% Adjusted1
1 Adjusted results are non-GAAP financial measures. Refer to “Non-GAAP and Other Financial Measures” in the “Financial Results Overview” section in the 2023 Management’s Discussion & Analysis (MD&A).
2 Reported basis excluding Corporate segment.
3 These measures have been calculated in accordance with OSFI’s Capital Adequacy Requirements and Liquidity Adequacy Requirements guidelines.
4 For additional information about this metric, refer to the Glossary in the 2023 MD&A.
5 25-year CAGR is the compound annual growth rate calculated from 1998 to 2023.
6 5-year CAGR is the compound annual growth rate calculated from 2018 to 2023.
7 Performance indicators that include an earnings component are based on TD’s full-year adjusted results (except as noted).
8 Revenue is net of insurance claims and related expenses.
9 Canadian Peers – defined as the other four big banks (RY, BMO, BNS and CM). All Peers are based on fiscal 2023 results ended October 31, 2023, closing stock prices as of October 31, 2023 and dividends paid in calendar 2023 to October 31 per Bloomberg.