Now May Be a Good Time to Invest in Global Commercial Real Estate

Utilizing decades of commercial real estate experience, TD Asset Management Inc. (TDAM) launched a global real estate solution in 2019 – the TD Greystone Global Real Estate Fund L.P. (the "Fund"). In the little over five years the Fund has been in existence, the market has observed forced real estate shutdowns and the work-from-home phenomenon due to the COVID-19 pandemic, as well as unprecedented pressure on interest rates and real estate valuations.
Despite launching only a handful of months before the pandemic, the Fund has delivered positive performance since its inception on August 19, 2019, and it has outperformed broader, diversified global real estate indexes.1 The Fund delivered a one-year return of 1.2%, a three-year return of 1.9%, and a five-year return of 4.%, as of September 30, 2024.2 Meanwhile valuations have adjusted considerably, which is potentially increasing the attractiveness of new global real estate allocations for investors.
Figure 1: Delivering Attractive Relative Returns with Lower Standard Deviation
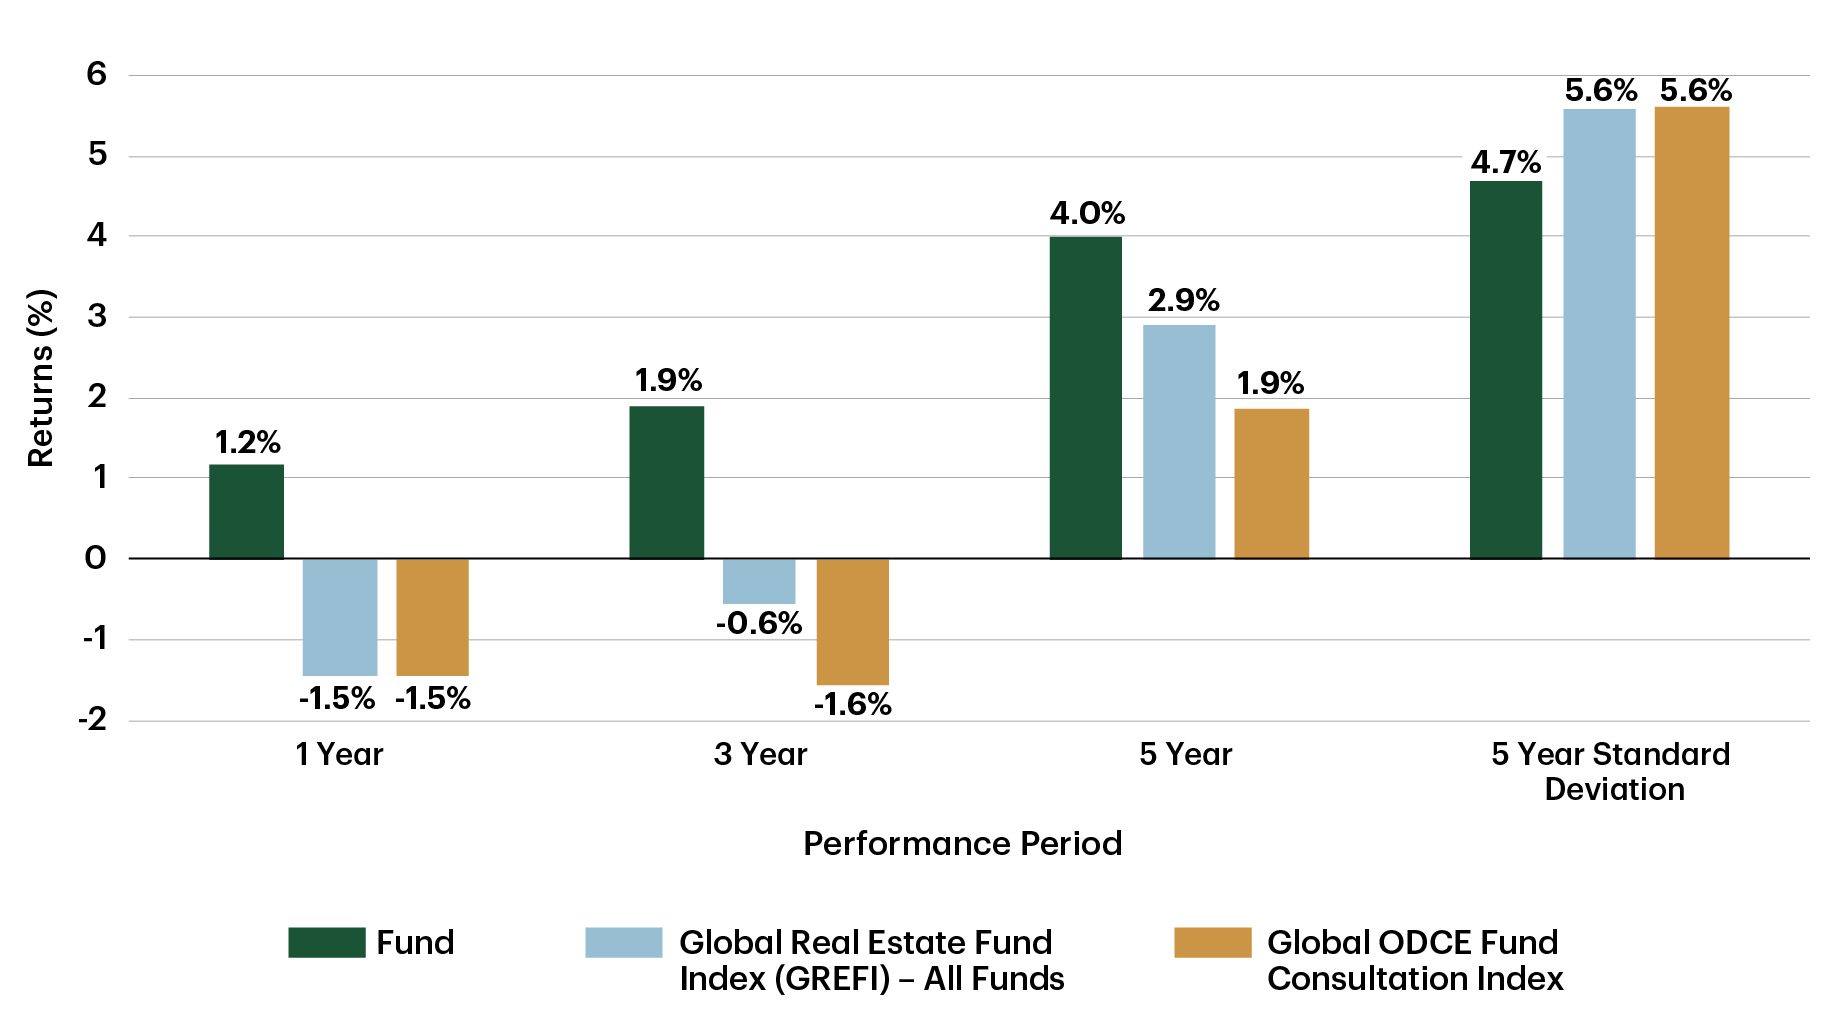
Note: Fund = TD Greystone Global Real Estate Fund LP. Returns in U.S. dollars. As of September 30, 2024 due to index publishing lags.
The GREFI (Global Real Estate Funds Index – All Funds) measures net asset value performance of non-listed real estate funds on a quarterly basis. The index was launched in 2014 and is published 12 weeks after quarter-end. The index release for the quarter ending on September 30, 2024 includes 436 funds and represents a total gross asset value (GAV) of USD $891.93 billion as of Q3 2024. The Global Open-End Diversified Core Equity (ODCE) is a subset of the GREFI index, including only non-listed, diversified core real estate funds, and included 49 funds and a total GAV of USD $350.3 billion as of Q3 2023.
Source: TDAM, Global ODCE Fund Consultation Index, Global Real Estate Fund Index - All Funds. As of September 30, 2024.
Open-ended Solution with Both Direct and Indirect Investments
The Fund offers an open-ended, turn-key global real estate solution with a strategic mix of direct and indirect investments. With investments in more than 150 cities around the world, the Fund provides broad diversification by region, property types and risk strategy. The Fund curated indirect fund investments to provide immediate diversification to investors at inception, but as it has grown, the Fund has increasingly taken a targeted approach for direct deals. Today, direct deals represent over 23% of the overall Fund and are forecasted to reach 43% by the end of 2025.
Figure 2: Continued Growth Through Targeted Direct Investments
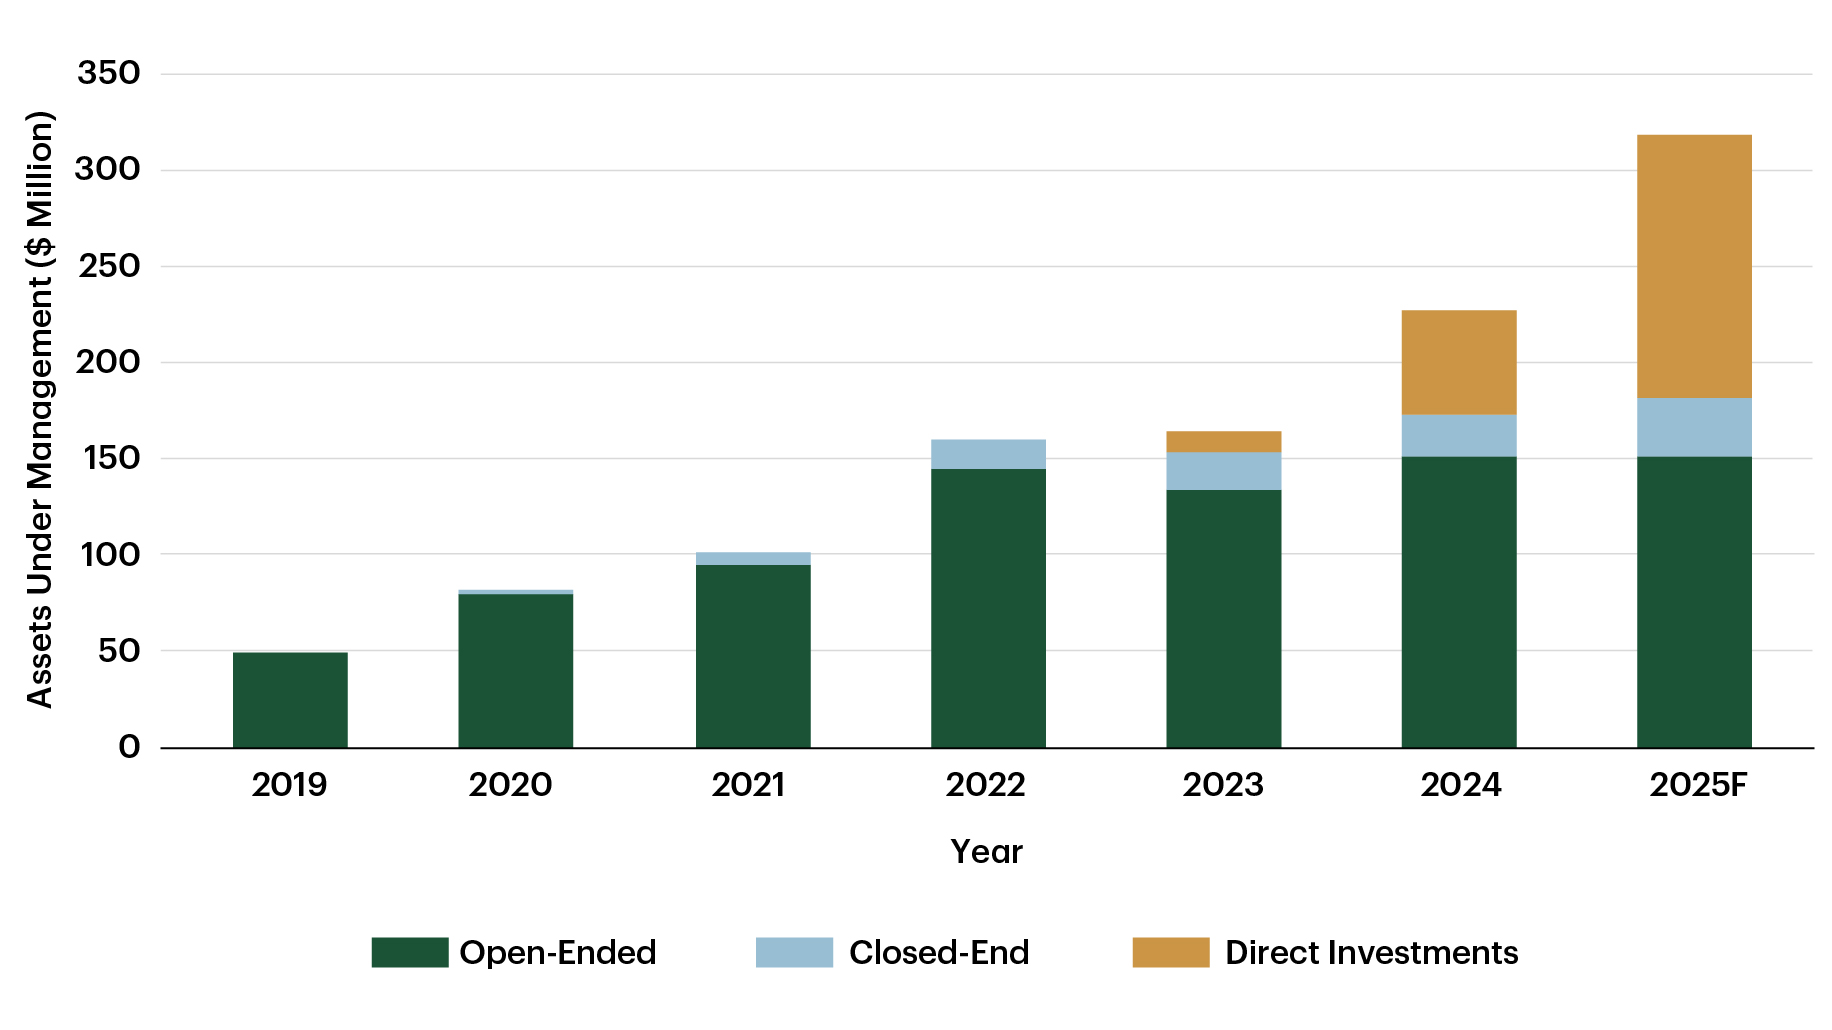
Source: TDAM. As of December 31, 2024.
Diversification
The ability to execute directly while providing an operational and tax-efficient solution3 across multiple jurisdictions worldwide can be attributed to over 35 years of experience managing real estate portfolios. TDAM's real estate investment process aims to deliver predictable and growing income while reducing the risk of an investor's overall portfolio. The discipline behind our philosophy is perhaps most evident in the reduction of risk through strategic diversification of the Fund compared to broadly diversified global real estate benchmarks.
For instance, given Asia-Pacific's low GDP correlation relative to other regions and its long-term growth drivers, the Fund has an overweight to the region through sector-focused strategies such as Australian Industrial. And although the Fund is underweight office as an overall sector, we have tilted the office composition to the Asia-Pacific region. This has been beneficial, as the work-from-home phenomenon has been less prominent in the Asia-Pacific region compared to other regions.
The Fund is also overweight life sciences and student housing due to their lower correlation with other more cyclical property types, shown as "other" in Figure 3.
The goal of reducing cyclicality, and by way of this, volatility, is further pronounced by a strategic underweight to the heavily cyclical office sector in the U.S. The objective of stable returns is further emphasized by large allocations to multi-unit residential and industrial properties, which tend to be less cyclical than office and retail overall.
Figure 3: TD Greystone Global Real Estate Fund L.P. Relative to GREFI
|
TD Greystone Global Real Estate Fund L.P. |
Global Real Estate Funds Index – All Funds (GREFI) |
Industrial |
37.7% |
32.7% |
United States |
8.4% |
18.5% |
Europe |
15.2% |
9.4% |
Asia Pacific |
14.1% |
4.8% |
Office |
12.8% |
21.8% |
United States |
2.4% |
7.5% |
Europe |
2.5% |
7.8% |
Asia Pacific |
7.9% |
6.5% |
Retail |
8.8% |
11.6% |
United States |
3.2% |
3.9% |
Europe |
3.2% |
4.7% |
Asia Pacific |
2.5% |
2.9% |
Multi-Unit Residential |
25.9% |
22.3% |
United States |
8.0% |
13.5% |
Europe |
15.4% |
8.1% |
Asia Pacific |
2.6% |
0.6% |
Other |
14.7% |
11.7% |
United States |
10.1% |
4.8% |
Europe |
4.3% |
5.9% |
Asia Pacific |
0.3% |
1.0% |
Property Type Total |
100.0% |
100.0% |
|
|
|
United States Total |
32.1% |
48.2% |
Europe Total |
40.6% |
35.9% |
Asia Pacific Total |
27.3% |
15.9% |
Source: TDAM, GREFI based on market value of underlying funds. As of September 30, 2024.
Targeted Approach to Direct Investments
The Fund's sizable allocations to multi-unit residential and industrial properties, particularly in Europe, also highlight the targeted approach to direct investments. Bolstered by over 35 years of direct transaction experience, the Fund has recently taken advantage of price-to-value dislocations in Europe and this region has begun to outperform since.
During Q4 2023, the Fund made a direct investment in a portfolio of 30 multi-unit residential properties in Finland. The portfolio is comprised of over 1,200 multi-unit residential units, with two-thirds of the portfolio located in Finland's largest cities: Helsinki, Turku and Tampere.
In Q1 2024, the Fund made a direct investment in a portfolio of two purpose-built rental multi-unit residential assets located in London, U.K. The portfolio is comprised of 490 units, situated in the Wembley Park Estate in North London, with excellent transit connectivity to Central London. The Portfolio is expected to benefit from London's strong rental market, which continues to see a severe lack of institutionally owned and managed multi-unit residential assets.
In Q3 2024, the Fund made a direct investment in nine urban logistic assets in the U.K. The U.K. industrial properties are in dense nodes, making them desirable last-mile locations. The investment aims to provide visibility to income growth with a gap-to-market rent of 39%, contributing to a 16% targeted return on investment.

Svanströminkuja 9 | Helsinki

Beton | London

Houston Business Park | Livingston
Strategic diversification to regions and sectors with more predictable income growth, augmented by direct acquisition capabilities, have the potential to deliver resilient and attractive returns. By focusing on strategic diversification first, and increasingly delivering targeted direct acquisitions, the Fund has constructed a solution that has proven this, as shown in Figure 4.
Figure 4: Total Return Index for Fund and Global Peers
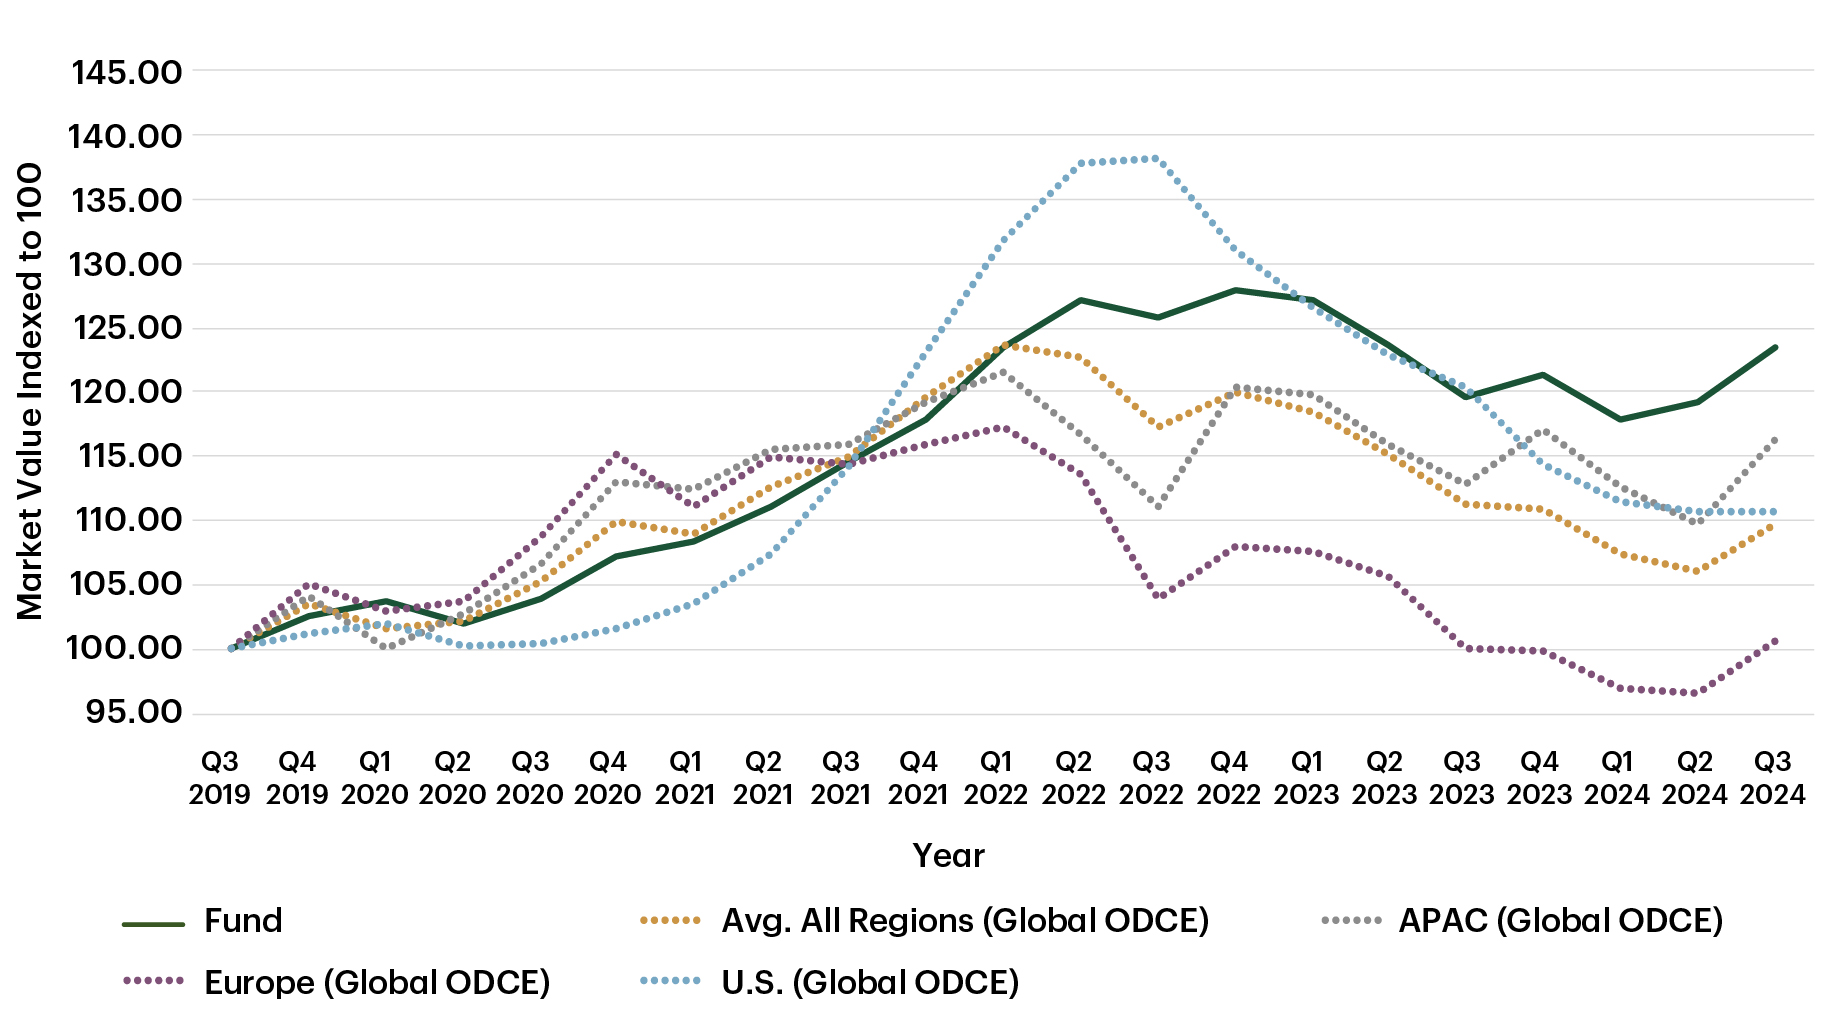
Note: Fund refers to the TD Greystone Global Real Estate Fund L.P.
Source: TDAM, GLOBAL ODCE Fund Consultation Index. As of September 30, 2024 due to index publishing lags.
The last five years have presented a plethora of headwinds for commercial real estate performance. Considering the magnitude of the real estate valuation adjustment witnessed across the globe, 2025 is arguably shaping up to be a good year for gaining exposure to global private commercial real estate. Building on over 35 years of real estate experience, we believe the TD Greystone Global Real Estate Fund L.P. is an attractive option for investors looking to diversify their return streams into the global real estate asset class.
1Relative returns are in U.S. dollars as of September 30, 2024.
2Fund returns are in U.S. dollars as of September 30, 2024 due to index publishing lags.For Canadian institutional investment professionals only. Not for further distribution.
3Tax implications may differ based on the investor.
The information contained herein is for information purposes only. The information has been drawn from sources believed to be reliable. Graphs and charts are used for illustrative purposes only and do not reflect future values or future performance of any investment. The information does not provide financial, legal, tax or investment advice. Particular investment, tax or trading strategies should be evaluated relative to each individual's objectives and risk tolerance.
Where the information has been provided by an underlying third-party fund manager it is for information purposes only and has not been calculated, reviewed or verified by any representative of the underlying third-party fund manager or their respective affiliates. The information is confidential and may not be disclosed to another party without prior written consent of TD Asset Management Inc.
This material is not an offer to any person in any jurisdiction where unlawful or unauthorized. These materials have not been reviewed by and are not registered with any securities or other regulatory authority in jurisdictions where we operate.
Any general discussion or opinions contained within these materials regarding securities or market conditions represent our view or the view of the source cited. Unless otherwise indicated, such view is as of the date noted and is subject to change. Information about the portfolio holdings, asset allocation or diversification is historical and is subject to change.
This document may contain forward-looking statements (“FLS”). FLS reflect current expectations and projections about future events and/or outcomes based on data currently available. Such expectations and projections may be incorrect in the future as events which were not anticipated or considered in their formulation may occur and lead to results that differ materially from those expressed or implied. FLS are not guarantees of future performance and reliance on FLS should be avoided.
For clients who hold real estate: MSCI/REALpac returns are not immediately available at quarter-end; therefore, the prior quarter’s index return is used in this report for benchmark calculation purposes.
Past Performance: Any performance information referenced represents past performance and is not indicative of future returns. There is no guarantee that the investment objectives will be achieved.
No investment strategy or risk management technique can guarantee returns or eliminate risk in any market environment. Any characteristics, guidelines, constraints or other information provided for this material is representative of the investment strategy and is provided for illustrative purposes only. They may change at any time and may differ for a specific account. Each client account is individually managed; actual holdings will vary for each client and there is no guarantee that a particular client's account will have the same characteristics as described herein. Any information about the holdings, asset allocation, or sector diversification is historical and is not an indication of future performance or any future portfolio composition, which will vary. Portfolio holdings are representative of the strategy, are subject to change at any time and are not a recommendation to buy or sell a security. The securities identified and described do not represent all of the securities purchased, sold or recommended for the portfolio. It should not be assumed that an investment in these securities or sectors was or will be profitable.
TD Global Investment Solutions represents TD Asset Management Inc. ("TDAM") and Epoch Investment Partners, Inc. ("TD Epoch"). TDAM and TD Epoch are affiliates and wholly-owned subsidiaries of The Toronto-Dominion Bank.
® The TD logo and other TD trademarks are the property of The Toronto-Dominion Bank or its subsidiaries.
Related content
More by this Author