Canada
 US
US


You are now leaving our website and entering a third-party website over which we have no control.
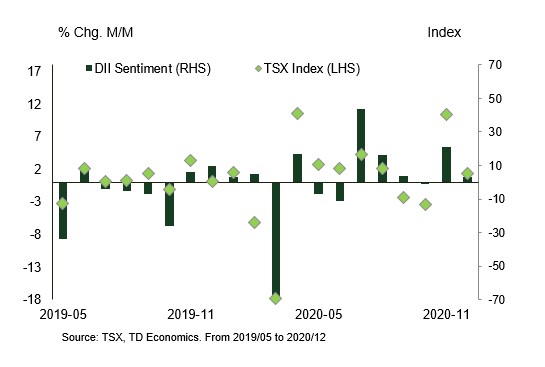
What is the TD Direct Investing Index (DII)?
The DII provides data and insights relating to historical self-directed investor activity. By looking at this historical activity, it can help us see how investors reacted to economic and financial market events.
The DII information below takes into consideration data for the full calendar month. Want to see how the DII works? Watch our explainer video. You can also learn more here.
Historic market trends
July 2021: Overall self-directed investor sentiment was neutral. Watch this video for market highlights.

Welcome to the TD Direct Investing Index
The TD Direct Investing Index (DII) provides data and insights relating to the historical self-directed investor activity. By looking at this historical activity, it can help us see how investors reacted to economic and financial market events.
For more information about the DII, read our FAQs. For insights into July’s self-directed investor behavior, read on.
July 2021: The optimism/pessimism tug-of-war results in neutral sentiment
Within the range of +100 to -100, July’s +2 DII sentiment score is firmly in neutral territory. Meanwhile, the S&P/TSX Composite Index showed a gain of +0.6%. But don’t let these apparently tranquil numbers fool you: two opposing forces -- increasing vaccination rate and rising concern of the delta variant -- were likely driving a lot of activity.
Let's start with the overall TD Direct Investing Index (DII) dropping 52 points from June’s score to get us to July’s neutral +2. (And yes: a 52-point drop is kinda a big thing).
Why the drop? The sentiment was pulled down by sector heavyweights Materials and Energy. Self-directed investor may have had concerns that the global economy has peaked. They sold more economically sensitive stocks, such as copper producer HudBay Minerals and lumber-related Western Forest Products (lumber declined 13.2% last month).
The Materials sector wasn't all down news. Gold prices rallied with lower real interest rates, a weaker U.S. dollar, and rising expectations that the Fed (the U.S. central bank) will maintain support for the U.S. economy. B2Gold, Kinross and Barrick were top buys.
Over to energy. Oil markets were volatile last month and a good illustration of July's tug-of-war. Uncertainty surrounding OPEC’s (Organization of the Petroleum Exporting Countries) planned production increase and concerns over the rising delta variant impacted global demand. Oil prices still climbed last month (+0.7%), although at an anemic pace. Self-directed investors took advantage and bought some of the Energy stocks as they dropped from the yearly high. Suncor and Enbridge saw the heaviest buying.
Another behemoth of a sector, Technology, was the top performer in July, led by semiconductors with NVIDIA and Micron among the most purchased in the sector by investors. Conversely, Apple, although up 6.5% last month and supported by a strong Q2 earnings release, was the top sold within the DII technology sector. Other top sells were Nokia and AMD.
Despite the building pessimism, Canadians seemed optimistic about the re-opening, as evident by the continued popularity of the movie theatre chain, AMC, and Canada's biggest airline, Air Canada.
Safety, risk, and there’s no place like home
Age groups, regions, and trading styles were really in their feelings in July.
Let's start with trading styles. Active traders (investors who made more than 29 trades the previous quarter) continued to display positive sentiment of +8, despite a significant drop from 38 of last month. Long-term investors (investors who trade less than 29 times per quarter) showed negative sentiment of -6, down from 17 in June. Both investor groups flocked into what might be considered re-opening stocks (e.g. AMC and Air Canada).
Moving to age groups, Boomer sentiment saw the sharpest monthly drop, from 19 last month to -12 in July, and contributed the most to the negative sentiment of the month. These investors still bought (and held) energy stocks, such as Suncor and Enbridge. Younger investors (Gen X, Y and Z) continued to appear to have more appetite in re-opening stocks such as AMC and Air Canada whereas older investors (Boomers and Traditionalists) sold securities with some uncertainty, such as Brookfield Property Partners and Inter Pipeline.
When we slice self-directed investor sentiment by region, investors from Ontario and British Colombia showed negative sentiments, which were balanced by investors from Quebec, the prairies and Territories, which showed positive sentiment. Again, we saw investors across different provinces betting on re-opening stocks such as AMC, Air Canada, Suncor, Cineplex and Carnival. We also observed home preference, in which investors in Alberta, Saskatchewan, Manitoba, and the Territories showed positive sentiment in energy stocks like Suncor.
While not quite a mullet sentiment (business in the front; party in the back), the tug-of-war between optimism and pessimism does illustrate mixed feelings. Self-directed investors were willing to invest in securities (rather than staying on the side-lines in cash or fixed income) but the securities they chose typically tended to be less volatile – securities and sectors that may resonate with them geographically. The exception, of course, are those re-opening bets. Maybe it is a mullet market after all.
August 2021: Overall self-directed investor sentiment was bullish. Watch this video for market highlights.
The TD Direct Investing Index (DII) provides data and insights relating to the historical self-directed investor activity. By looking at this historical activity, it can help us see how investors reacted to economic and financial market events. For more information about the DII, read our FAQs. For insights into August’s self-directed investor (SDI refers to investor) behaviour, read on.
August 2021: Watching the Grass Grow
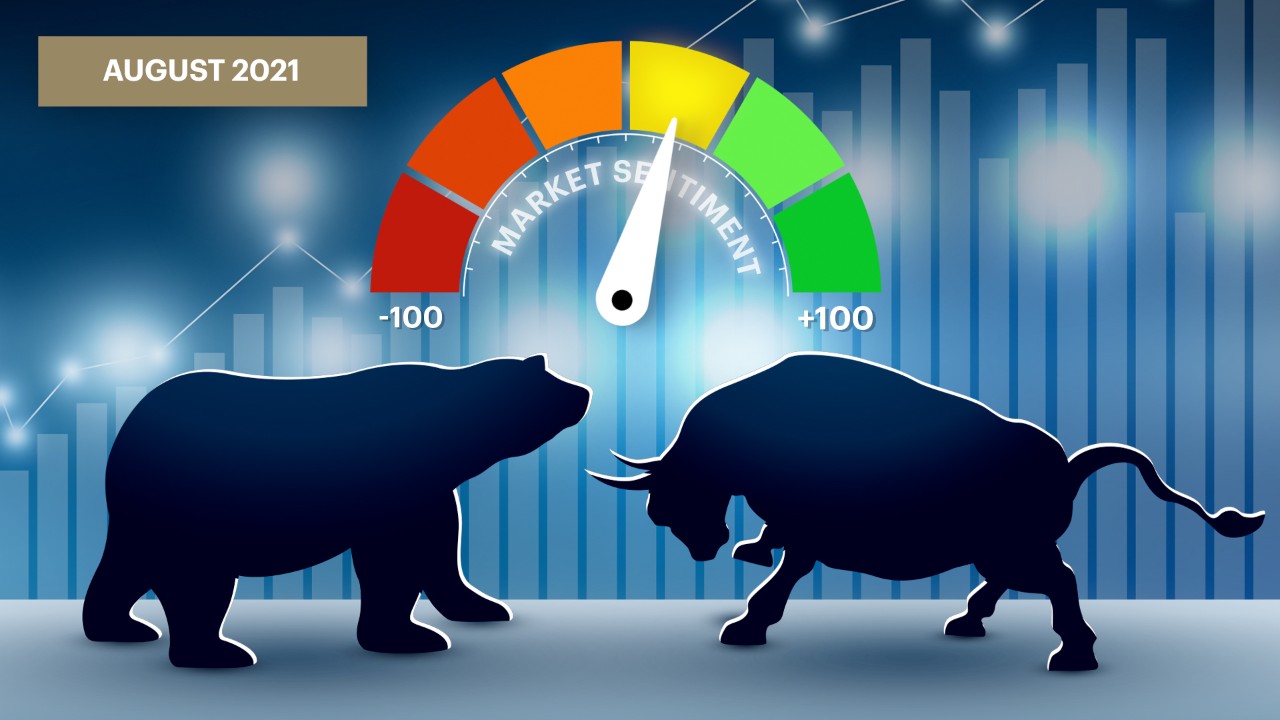
August is rarely known for market shenanigans and this year's August DII sentiment is slow and subtle, like watching grass growing: a slightly optimistic +9, which is up 7 points from July's +2. Remember, this is in a range of +100 (for bull) and -100 (for bear) and continues the subtle bounce-back from that massive 52-point drop between June and July. While only a slight increase, it was reflective of the overall market move (+1.5% return for the S&P/TSX Composite Index over the same period). This is where the markets grew way faster than grass: North American equities continued to set new all-time highs, possibly pushing concerns over the Delta variant to the backburner. The improvement in sentiment was driven by strong earnings and positive news coming from Financials, Healthcare, and Communications.
The wind beneath the sails
Financials (+11) were upbeat, mainly due to the anticipation and delivery of better-than-expected reported earnings from the big Canadian banks. The most popular securities included BNS (Bank of Nova Scotia) and GSY (GoEasy). We also saw a rotation out of U.S. banks and into Canadian banks, which may have been triggered by the higher dividend yields in Canadian banks. Given the propensity for many older investors and long-term investors to desire higher dividend stocks, this rotation may have been reflected in a notable improvement in Boomer sentiment as well as long-term investor sentiment. The most sold securities included BAC (Bank of America), WFC (Wells Fargo), and C (Citigroup).
Healthcare (+6) was buoyed by a combination of cannabis and COVID-19 vaccination potential. In the cannabis space, HEXO (Hexo Corp.) and WEED (Canopy Growth) were popular stocks. Given that these two cannabis companies were down significantly in August, this could be an example of investors buying on the dip. With respect to traditional pharmaceuticals, PFE (Pfizer) was in demand coinciding with the expected need for vaccine booster shots to be rolled out in the U.S. We saw this played out in the activity of Gen Z and Millennial investors, who favored Healthcare stocks, and within the Active Trader group.
The final sector that exhibited positive sentiment in August was Communication, up +5 from July. All age groups contributed to this higher sentiment, with Boomers as the main drivers of the increase in sentiment. When we look at the most bought securities in Communications, the meme stock, AMC, was the most purchased among Gen X, Gen Y and Millennials. The fact that they bought heavily at 52-week highs, one of the DII proxies, caused a move up in sentiment.
Un-slumping yourself is not easily done
Materials (-17) weighed heavily on August's overall sentiment. Materials stocks were down, most notably lithium producer, LAC (Lithium Americas Corp); steel producer, X (United States Steel Corporation); and mining company, TECK.B (Evolve FANGMA Index ETF CAD Unhedged), which all saw a net sell in August. In fact, LAC was among the most sold stocks in the Active Trader group and dragged down the sentiment of that group. Geographically, Ontario was particularly affected by the pessimism in Materials, and was weighted down by stocks such as LAC, NOT (Noront Resources Ltd) and X. One sweet note amid the sour: ABX (Barrick Gold) was in the most bought category. With less fear in the market that the Federal Reserve will cause a repeat of the taper tantrum (which occurred post-Global Financial Crisis), the reduced threat of rising interest or inflationrates appeared to have been good for gold in August.
Although not as negative as Materials, Consumer Staples (-2) came in second only to Materials in August sentiment. The sector was mostly weighed down by food producers such as MFI (Maple Leaf Foods Inc) and TSN (Tyson Foods, Inc), and chained grocery stores such as WMT (Walmart), MRU (Metro) and L (Lowes), which may be related to people starting to get more comfortable dining out instead of eating at home. This also resonated with the lower sentiment in Ontario, which may be a result of the province being under tighter outdoor restrictions compared to other provinces.
Know when to fold them
Technology fell into the most sold category in August, despite being up +3.4% in the markets. This may reflect some profit-taking amongst some investors. Many stocks such as SHOP (Shopify), MSFT (Microsoft), and NVA (Nuvista Energy) were quite positive last month, as we saw a rotation back to growth stocks and away from cyclical value such as materials. Credit card stocks V (Visa) and MA (MasterCard) were also among the top net buys even with the price declining 7.0% and 10.3%, respectively last month.
…Or not
In an interesting twist, SU (Suncor), was on the most purchased list as well. Oil was volatile on the month given the negative growth news coming out of China and the risk that the Delta variant may slow growth. But with oil prices snapping back in the latter part of the month, investors seemed ready to jump in and ride the wave, possibly hoping that global growth fears would dissipate.
The August Doldrums
Meh. August was flatish and neutralish and, with a few exceptions, about as exciting as watching grass grow. Investors appeared to be cautious and the markets were waiting: what impact will the Delta variant have on future economic growth, particularly overseas? Current economic data has been slowing while overall corporate earnings have been better than expectations, but is that a trend? It appears that some investors, especially Boomers, were reluctant to take too much risk. Ontario was a drag with its low sentiment. Then again, market thrill-rides aren't to everyone's taste. So if you do want some drama, we recommend you read a book.
September 2021: Overall self-directed investor sentiment was bullish. Watch this video for market highlights.
September 2021: Sentiment Jumps While Markets Slump
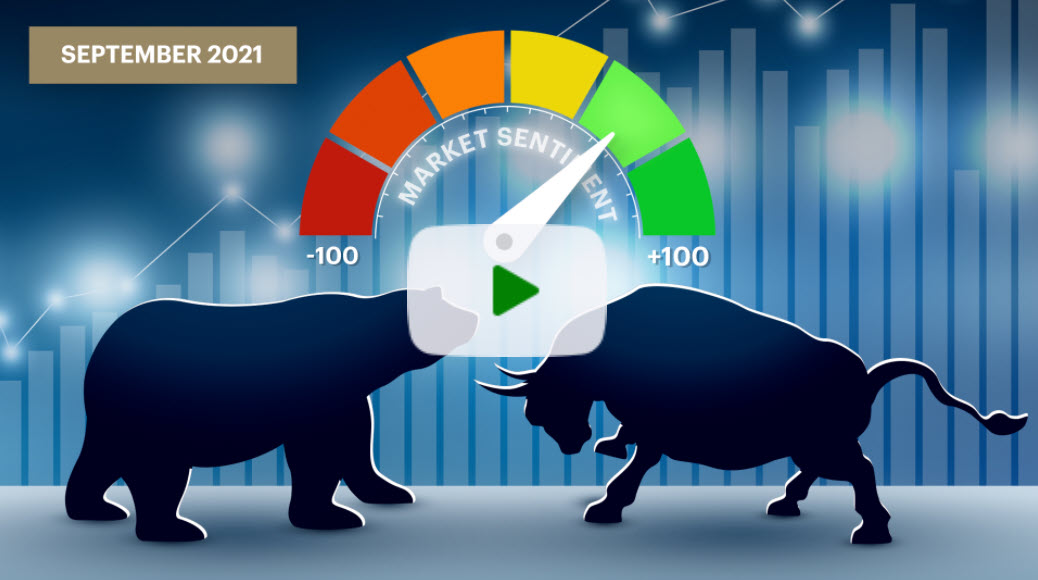
The end of summer brought volatility in markets, but that didn’t stop DIY investors. With the S&P/TSX Composite and the S&P 500 down 2.5% and 4.8% respectively, we would have expected sentiment to follow. Au contraire. The September DII sentiment rose to +37, up from +9 in August. Remember, the sentiment score is on a range from -100 (most bearish) to +100 (most bullish). Investor confidence in September was the tale of two sectors: energy having the best of times and materials with the worst.
September was fueled by headline events
The overall score for Energy rose to a high of +53 (from negative territory last month). Given all the action in the sector, it's no surprise that energy prices and sentiment rose. In addition to the active hurricane season (such as hurricane Ida in the U.S.), there were supply bottlenecks (most of Europe) and rising demand by consumers. Growing pressure from climate-conscious investors and governments for oil majors to green their business had appeared to lead to drillers’ hesitancy and a lack of CapEx (capital expenditure) in fossil fuel production. It was a classic case of market demand outpacing supply, which in turn appeared to help drive higher stock prices and investors getting in the action.
Canadian companies Tourmaline (TOU), Enbridge (ENB), and Suncor (SU) were the drivers of Energy sentiment overall. When we look at the sector from the perspective of age demographics, it was Boomers who jumped on the Energy train. This investor group had the highest allocation to Energy stocks relative to the other age cohorts. When we look at the sector from a geographic perspective, home bias is apparent. Energy sentiment was pushed higher by investors in the energy producing province of Alberta. We also saw investors in Ontario positioned in Energy, surprising given that investors in this province typically hold a lower allocation in their portfolios. Nationally, we saw both Active Traders and Long-Term investors bullish in this sector.
Materials lose their shine
The Materials sector was the main negative weight on the DII in September, dropping to a low of –25. With risks to China’s economic growth rebound flooding the newswires on the back of the Evergrande fiasco, weakness in copper and other base metals were apparent. The largest investor group to exhibit negative sentiment were Boomers (-15), who had the highest allocation to Materials of any age group. Looking at the sector from a trading style perspective, Active Traders, who jumped on the run up in base metals, showed the biggest drop. Copper producer Teck Resources (TECK.B) was among the top net sold.
The materials sector was also weighed down last month by gold and gold equities. Gold bullion posted its worst monthly value decline (-3.3%) since June and equities were even weaker (-9.8%) with Barrick Gold (ABX) and Kirkland (KL) the top sold gold stocks.
What influences the influencers?
September really was a tale of two sectors, each battling to have the most influence on investor sentiment. Energy prices rose on supply and demand factors, while Materials prices dropped on fears of a pull-back on economic growth in China. And the winner is… Energy trumped Materials, winning the title for being the biggest driver of overall sentiment.
The TD Direct Investing Index (DII) provides data and insights relating to the historical self-directed investor activity. By looking at this historical activity, it can help us see how investors reacted to economic and financial market events. For more information about the DII, read our FAQs.
October 2021: Overall self-directed investor sentiment was bullish. Watch this video for market highlights.

October 2021: The Generational Divide: Which Side Are You On?
The historically volatile month of October ended with a surprisingly positive sentiment of +52, moderately up from last month's reading of +37. October sentiment sits firmly in bullish territory. Remember, the sentiment score is on a range from -100 (most bearish) to +100 (most bullish). Likewise, the TSX was up 3.7% in the same month. In October, we also saw an interesting trend emerge in investor confidence: the generational divide. There was strong demand for both old and new guard securities, with Boomers rocking it old school, and Gen Z and Millennials getting in their feelings with the next generation of companies.
Grey Power
Energy sentiment continued to lead confidence in all sectors for the second straight month. At +19, energy benefited from strong price appreciation in oil and natural gas markets. Energy supplies were still constrained globally and combined with the demand surge on the back of a rebound in global mobility, more pressure was placed on prices.
How did the generations respond? Traditional energy companies Suncor Energy (SU), Enbridge (ENB), and Whitecap Resources (WCP) were among the top 5 most popular stocks amongst the Boomer and Traditionalist generations. The closest they got to next gen firms was Algonquin Power & Utilities Corp. (AQN – Utilities sector), which has positioned itself in the renewable energy space. Make no mistake: all age groups pushed this sector and these securities up the ranks. The younger generations were simply more focused on high growth stock in other sectors while the Boomers and Traditionalists focused on these stable, dividend stocks. Geographically, this same trend of 'trade where you live' emerged, with energy stock demand most apparent in the energy-exposed provinces of Alberta, Manitoba, and Saskatchewan.
We Are (All) Living in a Material World
The materials sector was the next most popular sector, up 37 points to +12 sentiment, as industrial and precious metal companies saw strong investor demand. Popular names were Barrick Gold (ABX), Lithium Americas Corp (LAC), and Teck Resources (TECK.B). We would classify the improvement in sentiment as broad-based. In other words, the generations agree: this is a materials market. All investor age groups showed improved sentiment, with Boomers showing the greatest improvement. In terms of trading style, long-term Investors favoured materials, though active traders also rode the wave (to a lesser degree). The provincial breakdown was a little bit more obvious, as investors in Ontario, BC, and the Territories showed the greatest improvement in sentiment in this sector.
YouthQuake 2.0
When it comes to the companies positioned for the future, Gen-Z, Millennial, and Gen-X invested in a range of stars in different sectors such as Tesla (TSLA - Consumer Discretionary), Facebook slash Meta Platforms Inc. (FB - Communication), with a dash of Shopify (SHOP – Technology). Both Tesla, which soared to a $1 trillion valuation on the back of an expected jump in new car sales, and Meta, with negative coverage of its societal impact then its subsequent tilt to the metaverse, were getting lots of digital media ink in October. More interesting (correlation not causation) is these companies have huge social footprints, which is where younger investors comfortably spend more time than their older investor counterparts.
Elsewhere in next gen: recent top picks, like AMC Entertainment Holdings (AMC – Consumer Discretionary) and Air Canada (AC - Industrials) were holding in the top 5 but were sliding in popularity. Active Traders and those in Quebec, Ontario, and BC were also big into next generation stocks.
The Big Reveal
So. Were older generations more conservative with a focus on wealth preservation and younger generations ready to take risks on innovation? Yup. October's numbers seem to say as much. What was perhaps more interesting were the layers on top of that - some of the factors which may have driven investor decisions, from familiarity (buy what you know) to home bias (buy where you live). And dare we say - to hopes and dreams (buy the world you wish for).
The TD Direct Investing Index (DII) provides data and insights relating to the historical self-directed investor activity. By looking at this historical activity, it can help us see how investors reacted to economic and financial market events. For more information about the DII, read our FAQs.
November 2021: Overall self-directed investor sentiment was bullish. Watch this video for market highlights.
For the first time since we began the TD Direct Investing Index, Atlantic Canada topped the charts with the highest positive sentiment in Canada.
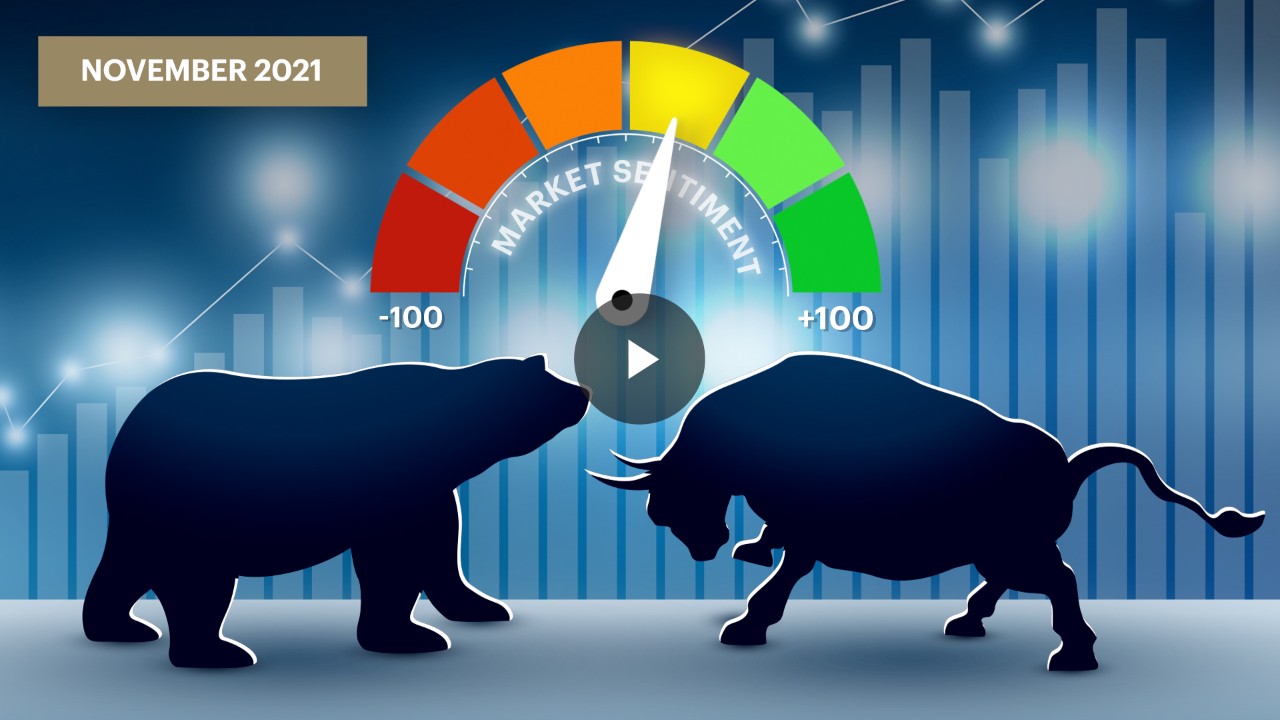
Let's set the stage. Remember the market earthquake between February and March of 2020 when the impact of Covid-19 finally sunk in? Well, in November 2021, news of the Omicron variant may have caused yet another after-shock. Though equity prices were rising fast for most of November, the negative news headlines at the end of the month led in part to equity markets to pare back gains. This left the DII sentiment index down 31 points from October, to November's bullish sentiment of +21. Remember that the DII sentiment score ranges from +100 for most bullish to -100 for most bearish. The TSX was up 0.8% over the same period.
So that's the background. Now, here's the big story. This change in sentiment wasn't shared equally across Canada. When we look at sentiment based on geographic location, a significant divide emerged.
East coast showed us some love
Let's start with the most optimistic region. That honour went to Atlantic Canada. Investor sentiment doubled to a level of +7 points, powered by positive sentiment in every single equity sector. That's right. Every. Single. Sector. Experiencing the most positive sentiment was Information Technology (IT). In fact, demand for stocks in the IT sector was over four times the level of the next most favoured sector in Atlantic Canada (Materials). We see HIVE (Hive Blockchain Technologies out of B.C.), NVDA (Nvidia Corporation), and PYPL (Paypal Holdings, Inc.) were the top bought IT stocks. Given PYPL and NVDA are high beta stocks (beta measures price swings relative to the market) and with the market swings towards the end of the month, those stocks were even more volatile than normal.
Smack dab in the middle Quebec and the Prairies
Investors in Quebec and Prairies were smack dab in the middle on the sentiment (the joy of trading) scale, with scores of +5 points each. We saw Investors in all four provinces embracing IT, though to a much lesser degree than Atlantic Canada. Quebec leaned to many of the same IT securities as Atlantic Canada, with NVDA (Nvidia Corporation), PYPL (Paypal Holdings, Inc.), and the fiery AAPL (Apple) getting a hot minute. In the Prairies, NVDA and PYPL were the top 2 bought, and SHOP (Shopify), and AAPL were the top 2 sold.
Cranky Ontario and BC
The biggest change from last month came from the sentiment of investors in Ontario and BC. Ontario sentiment dropped 21 points, from +24 to +3, while B.C. went below 0, dropping from +9 to -1. Investors in Ontario favoured IT -- NVDA, PYPL, AAPL -- and consumer stocks -- TSLA (Tesla, Inc.), COST (CostCo Wholesale Corporation), and WMT (Walmart, Inc.). They also soured on Financials -- MFC (Manulife Financial Corporation), and BNS (Bank of Nova Scotia) -- and Industrials -- AC (Air Canada) and PLUG (Plug Power, Inc). Comparatively, in BC, investors sold Consumer Discretionary stocks TSLA, AMZN (Amazon), NIO (Nio, Inc.), Financials stocks MFC (Manulife Financial Corporation) and RY (Royal Bank of Canada). Others to drop in sentiment were Energy stocks SU (Sunlife) and CVE (Cenovus Energy Inc.) and, most notably, Materials stocks TECK.B (Evolve FANGMA Index ETF) and ABX (Barrick Gold).
How're you feelin’? What about your folks?
There are all sorts of ways to slice sentiment: age range, trading style, sector, or region. Use the filters in the charts below to find your people and your family to see how they felt in November. Now we will modestly quote our own paper, Understanding Investor Behaviour:
"The actual investment decisions of individuals may be the most honest representation of investor feelings and beliefs. By looking at self-directed investor trading activity, we can see how people react to economic and financial market events…"
In short, Atlantic Canada felt just fine in November. They liked what was going on and showed it with their trades. It'll be interesting to see if they stay positive.
The TD Direct Investing Index (DII) provides data and insights relating to the historical self-directed investor activity. By looking at this historical activity, it can help us see how investors reacted to economic and financial market events. For more information about the DII, read our FAQs.
December 2021: Overall self-directed investor sentiment was bullish. Watch this video for market highlights.

Even with Omicron risks flooding the news headlines in December, the DII brushed aside negativity, remaining in positive territory at +20. This continues a streak of nine straight months of positive investor sentiment. At the same time, the S&P/TSX Composite Index climbed a healthy 2.7% on the month. Remember that the DII sentiment score ranges from +100 for most bullish to -100 for most bearish.
Money, money, money
Our top sector in December was Financials. Canadian banks posted their year-end results at the tail end of the year. And this was a case of 'surprised to the upside' with the big ones, such as Scotiabank (BNS), Manulife (MFC), and Royal Bank of Canada (RY), posting stronger than expected results.
There are a few ways to slice this insight. Demographically, Traditionalists and Boomers led the move. These two groups tend to be more heavily exposed to Financials compared to younger investors, partly due to the sector’s typically higher yields and strong dividend growth. Geographically, home bias played a significant role, as investors in Ontario led the move to the Financial sector. This follows past DII geographic observations, which revealed that there may exist a strong home bias that causes Ontarians to be significantly overweight in bank stocks given most bank head offices are located in Ontario.
Shop till you drop
Gifts weren’t the only thing being bought this holiday season. Feeling confident in the IT and Consumer Discretionary sectors, investors favored companies that were poised to benefit from increased consumer spending. Stocks like NVIDIA Corporation (NVDA), Apple Inc (AAPL), and Shopify (SHOP) were top IT stocks, while the highly traded and more volatile Tesla (TSLA), GameStop Corp. (GME), and Alibaba Group Holding LTD (BABA) were top discretionary buys. These stocks were popular amongst Active Traders, more specifically Gen Z, who jumped on recent trends. Spreading holiday cheer were investors in Ontario and BC, who contributed most to the positive sentiment in these sectors.
The weakest link
While some sectors were on a high, others didn’t fare as well. Materials stocks were the least favoured in December. This was apparent mostly with the Boomer generation and investors that live in BC. The negativity was also apparent with Active Traders who are generally quick with the sell trigger whenever bad news hits, such as, the BC floods, which may have had an outsized influence over the Materials sector this month. Gold stocks such as Barrick (ABX) and Kinross (K) were among the top bought as investors added to their gold positioning on rising covid risks.
Houston, we have a problem
The Energy sector lost some steam in December as investors exhibited negative sentiment. With Omicron denting travel plans, the expected drop in global mobility seemed to negatively influence energy demand. This is significant since over two thirds of all energy demand comes from global mobility. Air travel, driving, and shipping are big energy users and stall with lockdowns. Enbridge (ENB) and Suncor Energy (SU) were the most impacted stocks.
Finishing 2021 on a fundamentally high note
Our year-end felt like a textbook case of macro-economic fundamentals. Big picture topics and events played a clear role in what investors did and how they felt. Outperforming year-end earnings results for banks led to positive sentiment for Financials. With holiday shopping sprees on their side, the IT and Consumer Discretionary sectors didn’t fare too badly either – however, the Omicron variant and other current events put a sour note in the Materials and Energy sectors.
Despite a year packed with macro-economic events, Canadian retail investors closed out 2021 feeling positive. Yay us! And a happy (belated) new year.
The TD Direct Investing Index (DII) provides data and insights relating to the historical self-directed investor activity. By looking at this historical activity, it can help us see how investors reacted to economic and financial market events. For more information about the DII, read our FAQs.
January 2022: Overall self-directed investor sentiment was bullish. Watch this video for market highlights.

The start of the new year saw the DII remaining positive for the tenth straight month at +24, despite some volatile activity in the market that could have eroded some of that bullish sentiment. Investors sold riskier assets in bulk, a move that hasn’t been seen since the start of the pandemic. The S&P 500 Index and the NASDAQ Index dropped significantly and finished the month down -5% and -9%, respectively. Comparatively, the S&P/TSX Composite Index finished down -0.6% over the same time period. The question then is how did the DII remain in positive territory? Let's find out.
Going off the grid
The answer becomes clearer when you look at the bigger picture. January saw investors selling their U.S. equities and moving their money to Canadian equities. So, while the market news was all about the dip, the DII sentiment stayed north. In particular, U.S. tech stocks were the big loser. The massive selloff in Technology came on the heels of growing fear that the (then) upcoming U.S. Federal Reserve rate hiking cycle would take the wind out of their sails. If we look at the sentiment for the Technology sector only, the DII dropped 18 points, to –13. Apple Inc. (APPL) and Nvidia Corporation (NVDA) being some of the top sold securities. The quickest demographic to drop them like hot cakes? Gen X and Boomers. Within the active trader and long-term investor groups, sentiment was most negative for the latter. On a geographic basis, the drop in sentiment was mostly driven by investors in Ontario.
Home team advantage
While investors were saying salut to their U.S. Tech stocks, they were saying bonjour to Canadian Energy and Financials. January saw oil prices skyrocket reaching a 7-year high! This caused a domino effect of improving supply and demand fundamentals—throw in rising geopolitical risks between Russia and Ukraine in the mix and Canadian Energy stocks must have been looking pretty good to investors as the sentiment moved up. What was the Energy sentiment you might ask? A high +24, with Suncor (SU), Enbridge (ENB) and Crescent Point Energy Corp (CPG) leading the way as the most bought stocks. Energy’s positivity was felt by all age groups with Gen X and Boomers leading the way. Active traders were clearly chasing trends as they drove sentiment higher. When it came to location, investors in Ontario were most optimistic on Energy, followed by the Energy heavy provinces in the Prairies and Territories.
Cash flow
When it came to where the money trail led last month, Canadian Financials, Royal Bank of Canada (RY), Toronto-Dominion Bank (TD) and Bank of Nova Scotia (BNS) were the top bought stocks by DIY investors. A potential reason for this uptick? The prospect of higher interest rates and, in turn, higher bank profits. On a demographic basis, Financials were popular across all age groups, led by Boomers and Traditionalists. Just as with Energy, active traders were the ones pushing Financials sentiment higher. With so many financial institution headquarters based in Ontario, this may be why investors from this province were arms and legs above the rest when it came to sentiment towards Financials.
Go Team Canada
An interesting corollary to January’s deke was that Canadians stayed invested. They dropped U.S. tech and bought Canadian Energy and Financials, but they didn’t move their investments off the table into cash. So there you have it. Canada’s victorious month explained in a nutshell, with the baffling sight of a positive investor sentiment amidst market turmoil quickly making sense.
The TD Direct Investing Index (DII) provides data and insights relating to historical self-directed investor activity. By looking at this historical activity, it can help us see how investors reacted to economic and financial market events. For more information about the DII, read our FAQs.
February 2022: Overall self-directed investor sentiment was bullish. Watch this video for market highlights.
Since the beginning of 2022, the markets have stumbled and soared in reaction to one event after another. We started with the threat of higher interest rates from the U.S. Federal Reserve, sky high inflation, and Omicron. Then, on February 24th, Russia invaded Ukraine. While the markets have been affected, it’s important to remember how devastating this event is, regardless of its impact on investors.
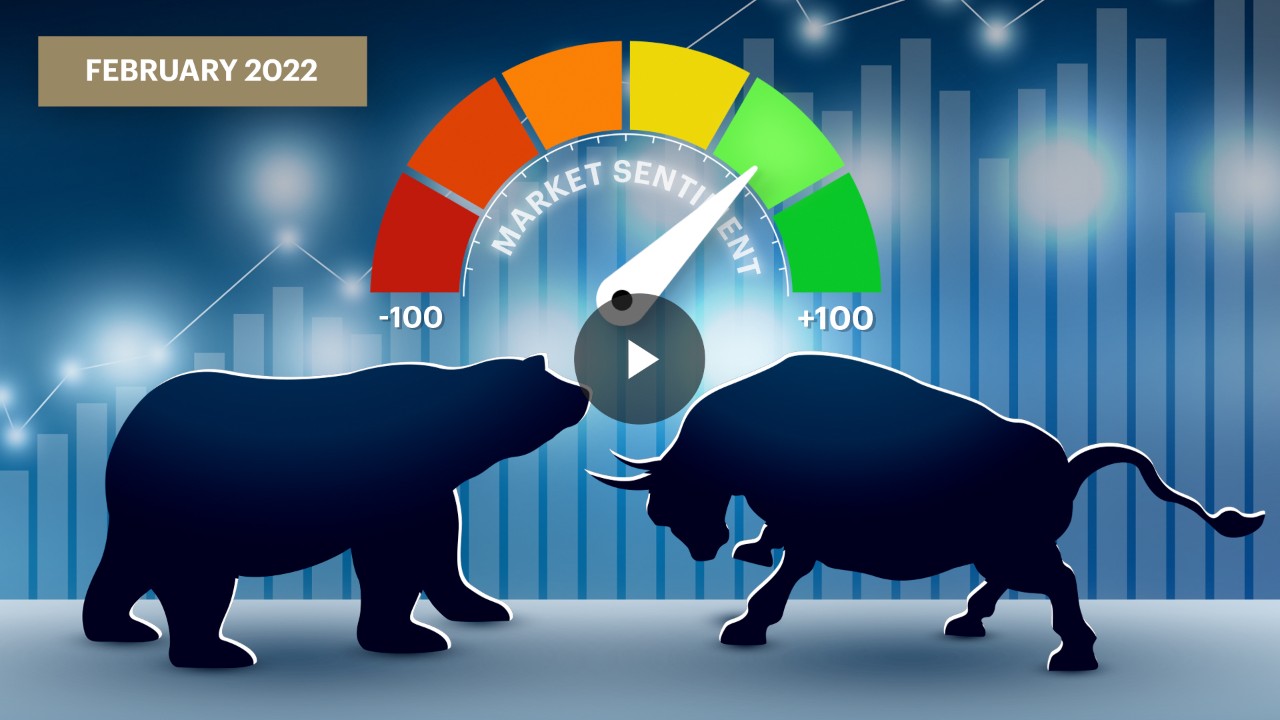
Retail investors had a counter-intuitive response: the DII investor sentiment rose strongly, to a 15-month high of +60. Remember that the DII sentiment score ranges from +100 for most bullish to -100 for most bearish. This very bullish sentiment followed decent gains from the TSX (+2%), which has benefited from its high weighting of commodity stocks. With the Russia – Ukraine conflict raising the risk of financial market stress, the question is what could have driven such strong gains in sentiment?
Commodity prices lead
The threat of sanctions on Russia caused massive price movements in a host of commodities, ranging from barrels of oil to bushels of wheat. This had the Energy and Materials sector sentiment score up to a high of +31 and +21, respectively. With respect to Energy, Suncor (SU), Enbridge (ENB), and Arc Resources (ARX) were the top buys, with investors potentially speculating that they would be buoyed by higher energy prices. On the materials side, Barrick (ABX), Agnico (AEM), and Lithium Americas Corp (LAC) were the top buys. We found that on a demographic basis, Gen X and Boomers were the drivers of positive commodity sentiment. Geographically, investors in Ontario, BC, and the Prairies showed the most positive sentiment for Energy, whereas it was really only investors in Ontario that drove positive sentiment for commodities.
Trading in Tech for Energy
The most negative sentiment of the month came in the I.T. space, with the DII showing a drop of -13, matching the negativity from January. These stocks may have been impacted by expectations of higher interest rates, with the US Fed set to embark on an aggressive tightening cycle. As Tech firms are typically high growth companies, higher interest rates have an outsized impact on the valuation of these firms. Shopify (SHOP), Lightspeed (LSPD), and NVIDIA (NVDA), were the top sold stocks. We found that Boomers were most likely to sell Tech stocks, followed by Gen X and then Traditionalists. These stocks were also sold equally by Active Traders and Long-Term Investors. We also found that investors from provinces that bought into Energy stocks (Ontario, BC, and Prairies), actively sold Tech stocks. For some, this implies there may have been a sector rotation strategy afoot.
Forging ahead through uncertainty
The last few years have been anything but normal, however, as the DII has shown us month over month, this does not necessarily mean Canadian investors are headed to bearish territory – in fact, investor sentiment continues to rise. It has shown that events, such as geopolitical crises and global pandemics, can affect the market differently and may even be different depending on which country the market resides. When it comes to the current geopolitical crisis, some Canadian stocks have seen growth, Energy and Material stocks in particular, and this is because of an abundance of resources that exist within Canada.
The TD Direct Investing Index (DII) provides data and insights relating to historical self-directed investor activity. By looking at this historical activity, it can help us see how investors reacted to economic and financial market events. This month's DII takes into consideration data from January 27th to February 25th. For more information about the DII, read our FAQs.
March 2022: Overall self-directed investor sentiment was bullish. Watch this video for market highlights.

In March, the DII investor sentiment dropped slightly from February's 15-month high of +60 to +51. Remember that the DII sentiment score ranges from +100 for most bullish to -100 for most bearish. This bullish sentiment kept in step with a 4% gain in the TSX, which continues to benefit from its heavy weighting of commodity stocks. The oldest generation – the Traditionalists – ranked the most positive in sentiment – given their exposure to commodities. The youngest generation – Gen ZY – were the least positive, as tech stocks continue to stumble.
What goes up
March felt like opposite day in the markets. The sectors and securities we were accustomed to seeing on top continued their downward trajectory while previously sluggish sectors and securities kept going up.
Let's break it down. The top sectors in March were materials and energy, with Canadian investors showing a 24% weighting in their portfolios -- not so long ago, these same stocks showed only a 7% weighting. We could see this played out as the Canadian market outperformed globally. The focus on commodities, from nickel, gold, and copper to wheat and lithium, was in sharp contrast to these securities being outperformed by high-flying Tech stocks. Top securities in materials were Nutrien (NTR) followed by Teck Resources (TECK.B) and Barrick Gold Corp. (ABX).
Tech reboot? Or just Control Alt Delete?
The TD Direct Investing Sentiment bases its sectors on the Global Industry Classification Standard (GICS). Why is this relevant? Because stocks you consider tech stocks may not be classified by GICS as “I.T.”. A good example is the FAANG stocks (an acronym for five major tech companies Meta (formerly known as Facebook), Amazon, Apple, Netflix, and Alphabet (formerly known as Google), which fall in multiple sectors. When we look at what's happening at the big tech firms, we may be looking at I.T. (Apple) or Consumer Discretionary (Amazon). Which brings us to the third most popular sector this month: Communications. This sector includes both Meta Platforms Inc. (FB) and Alphabet Inc. (GOOG), and both made an appearance in the top five bought. Over in I.T., we saw the sector bounce a bit, but it remained on the bottom, with Shopify (SHOP), Advanced Micro Devices (AMD), and Nvidia (NVDA) as the top sold.
The best of times, the worst of times
The Canadian resurgence was a validation to many investors who had shown confidence in the market in the previous month. But we also saw currency, inflation, interest rates, supply chains, and more lurking in the background– you know something might set off a tumble, but you don't always know what or when. It is a bit bumpy. So, hold on and enjoy the ride.
The TD Direct Investing Index (DII) provides data and insights relating to historical self-directed investor activity. By looking at this historical activity, it can help us see how investors reacted to economic and financial market events. This month's DII takes into consideration data from February 28th to March 25th. For more information about the DII, read our FAQs.
April 2022: Overall self-directed investor sentiment was bearish. Watch this video for market highlights.

For the first time in two years, investor sentiment dropped into bearish territory. The April score for the Direct Investing Index (DII) plummeted to -12, a massive move down from March's +51. Remember that the DII sentiment score ranges from +100 for most bullish to -100 for most bearish. As we sliced and diced the data, we saw a few glimpses of bullish (above neutral) sentiment in niche groups. For the most part, however, each sector, demographic, and trading style were bearish.
This may be the culmination of the fear and worries caused by, in no specific order: conflict in Ukraine; the market swing from tech to commodities; increased inflation; supply chain struggles; the increase of interest rates; fears of a slowing global economy; and China’s Covid lockdown. Canada’s retail investors hunkered down.
As the Markets Rotate
The flight to safety, one of the four cornerstones (proxies) that make up the DII, had a major role in our bearish sentiment. For example, there was a rout in growth stocks as investors left behind volatility and rotated to energy or to the sidelines in cash or cash equivalents (like fixed income).
Specifically, investors took their money out of Technology and put it in smaller sectors (like Energy). Because the Technology sector had been such a big part of people's portfolios, this shift was notable: tech heavy Nasdaq, for example, had the worst month since 2008. The FAANGs really showed their heft. Netflix, Meta, and Alphabet (GOOG) collectively lost USD $1 trillion in April, with Amazon (AMZN) and Apple (AAPL) reporting earnings after the end of this DII reporting period. However, investors used this pullback to add to positions in some of these beaten-up names such as Netflix (NFLX) and Meta (FB). The more economically sensitive semiconductor subsector also came under pressure last month with Nvidia Corporation (NVIDIA) and Advanced Micro Devices (AMD) among the net sold.
Going Up
Now over to Energy. Supply chain issues and more signs of reopening, such as airline travel, looked to push the demand and sentiment for Energy to the top position. Suncor (SU), Crescent Point Energy Corp (CPG), and Enbridge (ENB) were the top bought. The second highest sector, Consumer Defensive, showcased how investors were still looking for profits. Veru Inc. (VERU), a biopharmaceutical company, received FDA approval for phase 2 trials and was top bought.
Going Down
On the TSX, Materials plunged and became the most pessimistic DII sector. Copper was down, platinum was down, even gold lost its luster. In value, they're still up year over year, but the pull-back may be related to a retail investor desire to avoid exposure to these materials given the slowdown in China. Teck Resources (TECK.B) and Barrick Gold (ABX) were among the top stocks sold. Financials, another closely watched sector, retreated from its mid-February peak and was of heightened interest as investors expected the Bank of Canada to continue withdrawing monetary stimulus to tame inflationary pressures.
April: Welcome to the Waiting Place
Aside from Elon Musk and his Twitter (TWTR) drama, April’s sentiment was in the doldrums. Long-term investors and active traders were negative. The sentiment of all age groups dropped, with Boomers being the most pessimistic. Geographically, every region went down, with Ontario’s gloomy outlook showing the deepest drop. And so we waited, sitting on our piles of cash, wondering when things would go back to normal – and when they do, if it is the same normal or a new one altogether.
The TD Direct Investing Index (DII) provides data and insights relating to historical self-directed investor activity. By looking at this historical activity, it can help us see how investors reacted to economic and financial market events. April's DII takes into consideration data from March 28 – April 27. For more information about the DII, read our FAQs.
May 2022: Overall self-directed investor sentiment was bearish. Watch this video for market highlights.

Even a small bear is still a bear
This May, the TD Direct Investing Index DII investor sentiment was a bearish -7, up slightly from April’s -12, so more of a black bear than a grizzly. Still, any bear makes an impression, thus overall, we saw investors looking for safety. In parallel, the TSX declined 5%, from 3.3 to -1.7 in the same period. With everyone wearing their grim faces, the interesting action was in segment comparison – looking at how different demographics reacted. Remember that the DII sentiment score ranges from +100 for most bullish to -100 for most bearish.
To each their own
A lot of the negativity was early in May. As sentiment inched higher as the month marched on, we saw interesting pockets of sentiment spinning in different directions. The divergence depended on where the investors lived, their age, or their trading style.
First, active traders, who were up 7 points for a positive sentiment of +2. This group was chasing trends in the energy market, with Suncor (SU), Enbridge (EN), and Cenovus Energy Inc. (CVE) the top three bought. In fact, energy carried May and reached a new high. Long-term investors were down 2 points from last month, for a sentiment of -10.
Next, the generations. Gen Z and Millennials were the happiest as they chased trends in the IT sector, looking for any tech that appeared to have hit bottom. Some of the stocks they chased were Amazon (AMZN) and Apple (AAPL) which bounced from the bottom. Honorable mention to Shopify (SHOP), which seemed to be supported by the announcement of a possible stock buyback. Traditionalists were at a neutral sentiment last month. They already held energy, so were less moved by the threat of a bear market. Boomers and Gen X remained in negative territory.
Finally, by geography. With a home bias to energy, the Prairies were the most positive, and some of the most traded stocks were Crescent Point Energy Corp. (CPG) and Suncor (SU). B.C. and Quebec were slightly bearish at -1, but the most negative was Ontario at -10. With its home bias to tech stocks, Ontario bounced up +6 from last month yet was still clearly in the bears.
To have or not to have
Trading volumes dipped slightly as the bears began their hibernation. Yet there is one more insight to noodle: companies that tend to target the less affluent, like Walmart (WMT), reported less robust earnings than companies that target the affluent, such as Macy's (M) and Nordstrom (JWN), which saw earnings rise. DII sentiment reacted accordingly.
The TD Direct Investing Index (DII) provides data and insights relating to historical self-directed investor activity. By looking at this historical activity, it can help us see how investors reacted to economic and financial market events. This month's DII takes into consideration data from April 28 – May 27. For more information about the DII, read our FAQs.
June 2022: Overall self-directed investor sentiment was bearish. Watch this video for market highlights.

In June, a bear was sighted. Did you run like mad or stay in place hoping to stay safe and for the bear to go away? All sectors were down amid a growing concern over a potential recession. Or interest rate hikes. Or supply-chain disruptions. We saw that in the DII investor sentiment, which dropped significantly, from -7 in May to -46 in June. That type of drop indicates investors were trying to not poke the bear: looking for somewhere to safely hunker down. Remember that the DII sentiment score ranges from +100 for most bullish to -100 for most bearish.
Let’s talk about energy
Energy had the least negative sentiment (+4). By comparison, the second and third least negative sectors were Consumer Staples (-1) and Utilities (-1). Demand for energy remained high as the ongoing war in Ukraine continued to put pressure on the supply, and investors may have sought to take advantage of high energy prices.
Active traders were more optimistic on Energy, favouring Crescent Point Energy (CPG), Suncor Energy (SU) and Baytex Energy (BTE). Though energy may have less trading volume (suggesting a bearish take on the sector), active traders were buying on an advancing market, at a 52-week high. Even with active traders moving in, the impact of long-term investors moving out offset any tilt to bull territory, leaving Energy sentimentally neutral.
Shaken not stirred: a mixed reaction across all sectors and demographics
The IT sector went down (-6) as the perception of easy money continued to dry up. Last reporting period, some investors considered a few buzzy securities as undervalued, buying up what may have been perceived to be discounted securities. That brief glint of hope declined for the most part. A few investors did gravitate toward the sector, leaning on companies such as the recently split Shopify (SHOP), as well as Apple (AAPL) and Lightspeed Commerce (LSPD).
The Consumer Staples sector tends to see a steady stream of consumer activity even during periods of uncertainty. But even that notion was challenged as investor sentiment for the sector went down (-1), including drops for large retailers like Wal-Mart (WMT) and Costco (COST).
Breaking it down by age, Boomers were the most negative about the market in general but were most pessimistic on Financials (-8). Gen Z and Millennials were the least negative and gravitated toward IT stocks. The top stock bought by this demographic was Amazon (AMZN) (with second and third place going to Tesla (TSLA) and Shopify (SHOP)). The appeal of Amazon may have been, in part, due to the company's stock split offering. We'll have to wait until next month after more stock split options from companies like Alphabet (GOOGL), Spotify (SPOT) and Tesla (TSLA) are reflected in the DII to see if investors favour this option.
The TD Direct Investing Index (DII) provides data and insights relating to historical self-directed investor activity. By looking at this historical activity, it can help us see how investors reacted to economic and financial market events. This month's DII takes into consideration data from May 28 – June 27. For more information about the DII, read our FAQs.
September 2022: Overall self-directed investor sentiment was bearish. Watch this video for market highlights.
Sentiment was down in almost every place you looked. There was less risk appetite across all ages, and both long-term and active traders were similarly negative. This caused overall investor sentiment to plummet into the very bearish region of -56. This is the lowest sentiment score since March 2020 and the onset of the global pandemic. Remember that the DII sentiment score ranges from +100 for most bullish to -100 for most bearish1.
Many different volatile factors contributed to negative investor sentiment in September, including continued aggressive U.S. rate hikes to fight inflation - even at the risk of a potential recession; Russia increasing its assault on Ukraine; a weakening British pound; and the ongoing strength of the U.S. dollar negatively impacting commodities and equities. Things were bad, and investors wanted to find safety fast.
Recession fears affected everyone, albeit in different ways
Investors with the shortest time horizon before retirement were the most bearish. Boomers were down 20 points to -26, followed by Gen X, down 9 points to -13. Meanwhile, Gen Z /Millennials were down only 3 points to -5, an insignificant drop compared to Boomers. With recession risks rising and the last recession occurring between 2008-2009, investors under the age of 32 have never traded in this type of bear market.
What to do? Each cohort saw different sectors as safer places to make moves and seek shelter from the volatility. Gen Z and Millennials, who regularly trade in IT, moved into more opportunistic or traditionally high dividend paying stocks in the Energy and Financial sectors. Their top five purchased and sold included regular favourites such as Apple (AAPL) and Tesla (TSLA), but also Enbridge (ENB) and Bank of Nova Scotia (BNS), which are historically more popular with older demographics.
Boomers were down in every sector, and together with Traditionalists, didn't show much of a change in their sector sentiments by sticking with the traditionally high dividend-paying Energy sector, and Financials. However, older investors also seemed to consider trading from within the Tech sector, typically popular with younger investors, with Shopify (SHOP) and Tesla (TSLA) ranking in their top heavily traded stocks.
Rate hikes and a strong buck really hammered the markets
Basic Materials landed the top spot as the most heavily traded sector, but the reality is that its score didn't change from last month and still sits at 0 (all the other sectors were down). Demand concerns (slowing economy; China's zero-COVID policy) likely dealt Energy a blow, as the traditionally popular sector dropped 8 points to -5. Enbridge (ENB), Suncor (SU) and Crescent Point (CPG), were ranked in both the top five bought and top five sold.
U.S. rate hikes really hit the Tech sector (lower future cashflows), and investors took notice with sentiment falling to -14. Similar to Energy, tech companies like Shopify (SHOP), Apple (AAPL) and Nvidia (NVDA), cracked both the top purchased and sold. Financials followed suit, with a sentiment score of -7. Again, investors were split on picks, as top bought and sold both included Bank of Nova Scotia (BNS), Toronto-Dominion (TD) and Royal Bank (RY) in the top five.
Think local, act local
Regionally, sentiment was down across the country, with Ontario leading the way. Despite the negative sentiment toward Energy, it looked like investors in the prairies – a region traditionally more exposed to the energy industry – took interest in local energy players like Tamarack Valley Energy (TVE) and Baytex (BTE), in addition to sector favourites like Suncor (SU) and Enbridge (ENB). Tamarack was also a top bought stock by Traditionalists.
It seems like investors decided to test the waters with regionally local small capital energy names as a less risky investment. And as recent recovery efforts in the Maritimes and the U.S. southeastern coasts have shown us, it's that people focus on helping locally and supporting their own communities as they protect what they still have and rebuild what they lost.
The TD Direct Investing Index (DII) provides data and insights relating to historical self-directed investor activity. By looking at this historical activity, it can help us see how investors reacted to economic and financial market events. This month's DII takes into consideration data from September 1 – 30. For more information about the DII, read our FAQs.
1 In April 2022 we began a three-month transition of the DII methodology. During this period, we slowly adjusted the proxy logic and data modelling to improve the quality of our analysis. This transition was completed for the July 2022 data, at which time we also adjusted the monthly data to include the full calendar month. Accordingly, comparisons between periods with different methodologies may not be as accurate as comparisons between periods of the same methodology.
August 2022: Overall self-directed investor sentiment was bearish. Watch this video for market highlights.

The news cycle was full of gloom and doom last month, with headlines citing interest rates, inflation, climate concerns and the lingering effects of the COVID-19 pandemic. It's no surprise then, that investor sentiment remained in bearish territory in August. The TD Direct Investing Index (DII) was down -6 from last month for a sentiment score of -14. The TSX was also down 0.8% during the same period. Remember that the DII sentiment score ranges from +100 for most bullish to -100 for most bearish.
Coupled with the ongoing Russia-Ukraine crisis, the phenomenon of largely negative news populating our social media feeds in recent years coined its own phrase doomscrolling. With all that negativity in the air, investors hunkered down in any haven they found within the markets.
Fortune favoured the cautious
Cash and cash equivalents appeared to be a safe port in stormy waters, as all demographics appeared to lean into this asset class and out of Canadian equities. Investors found some decent interest rates on long-term and 30-day GICs.
Energy come out on top as the most heavily traded sector with a sentiment score of +3, boosted by increased interest from Generation Z and Millennials. The top energy stocks bought were Suncor Energy (SU), Enbridge (ENB) and Canadian National Resources (CNQ). Demand for energy was high as Russia announced it would cut its energy supply to the rest of Europe, causing an energy crunch. Utilities (0) and Healthcare (0) rounded out the top three heavily traded sectors.
Besides Ontario, the rest of Canada was largely neutral toward the markets. The prairies, where historically investors lean heavily into the energy sector, remained negative even as sentiment in Energy was slightly improved.
Younger traders still keen on meme stocks
Meme stocks proved to be popular in August. Bed, Bath and Beyond (BBBY) was the top sold and purchased by Generation Z and Millennials, and ranked in the top five sold and purchased by Generation X. It also ranked within the top five sold and purchased by both active traders and long-term traders by huge margins. The big box retailer struggled to survive last month as it dealt with slumping sales and turmoil in its executive ranks. Sentiment toward AMC Entertainment (AMC) was also up, largely driven by Generation Z and Millennials, and Generation X. Often considered a meme stock, Tesla (TSLA) ranked in the top five sold and purchased in all age groups and investor types.
Risky Business
Following the hawkish remarks that the U.S. Fed would continue to raise interest rates to fight inflation, there appeared to be increased investor pessimism toward high-risk investments. IT, considered to be very sensitive to rising interest rates, took a big hit and dropped -9 points for a sentiment score of -5. It was joined in the bottom three least traded sectors with Financials (-2) and Communication (-2).
So, how close are we to a recession?
The technical definition of a recession is two quarters of negative growth. August marked the fifth month1 in a row that investor sentiment toward the markets remained in bearish territory. But there are other factors that contribute to a recession to consider, such as the strength of the labour market. With the Fed committed to getting a handle on inflation to avoid a recession, investors will need to monitor how all factors may impact their trading activity.
The TD Direct Investing Index (DII) provides data and insights relating to historical self-directed investor activity. By looking at this historical activity, it can help us see how investors reacted to economic and financial market events. This month's DII takes into consideration data from August 1 – 31. For more information about the DII, read our FAQs.
1 In April 2022 we began a three-month transition of the DII methodology. During this period, we slowly adjusted the proxy logic and data modelling to improve the quality of our analysis. This transition was completed for the July 2022 data, at which time we also adjusted the monthly data to include the full calendar month. Accordingly, comparisons between periods with different methodologies may not be as accurate as comparisons between periods of the same methodology.
July 2022: Overall self-directed investor sentiment was bearish. Watch this video for market highlights.
Investors didn't have high hopes heading into July. Both the Bank of Canada ("BoC") and the U.S. Federal Reserve ("Fed") issued sharp interest rate hikes. Expectations for Q2 corporate profits were set low heading into the latest earnings season. So, when Q2 earnings reports came out and they weren't as bad as originally feared, the improvement was viewed as a win for investors.
Strong Q2 earnings opened the door for bargain hunters
DII investor sentiment landed at -8 for July1. Remember that the DII sentiment score ranges from +100 for most bullish to -100 for most bearish. Coming off the last three months of market selloffs, the score may have been largely the result of better-than-expected Q2 earnings results balancing out more cautious investors and negative views stemming from the aggressive central monetary policy and recent market volatility. Looking at the investor behaviour scores, we saw that July sentiment was lifted by investors chasing that upward market trend.
Last month marked the best month for Wall Street since November 2020. Bought at extremes was the lowest proxy (-24), indicating that many investors took advantage of "buying the dip" opportunities and bought low-priced stocks with stronger market performance.
Tech was the big winner
Sentiment was led by IT (+4) and Consumer Discretionary (+6) sectors. Shopify (SHOP) ranked as the top stock in IT and the most purchased stock for three demographics – Gen Z and Millennials, Gen X and Boomers. However, Boomers were split on the company, with Shopify also ranking as top sold. Tech companies dominated the top five for Consumer Discretionary, with Amazon (AMZN), Tesla (TSLA) and GameStop (GME) making the cut. The popularity of tech stocks, like Shopify, in Canada was likely because they're familiar names to investors and, coupled with prices which were lower than they have been recently, appeared as attractive buying opportunities for interested investors to start getting back into tech companies.
Energy (+2) was only mildly positive as outlook for energy was still impacted by fears that global demand was softening on a weakening economy. Sentiment toward Financials (-7) was negative amid the Fed's suggestion that the path of interest rate hikes may slow, leading to a flattening of the yield curve. While this may have negatively impacted Financials, the rate forecast may have helped boost sentiment for tech stocks.
Cautious optimism
Overall, investors felt less negative about the markets last month. Boomers were the most optimistic, although they remained in bearish territory. Active traders (defined as investors with 30 trades or more in the past 3 months) were mainly positive as well, but long-term investors (defined as investors with under 30 trades in 3 months) were more pessimistic toward the markets.
Ontario investors, who generally tend to invest in Financials, were bearish as the financial sector continued to be weighed down by the aggressive BoC rate hike. Prairie investors, who generally tend to invest a lot in Energy, were also bearish as the demand for energy dampened.
Should we set the bar higher?
Though investor sentiment was better in July, investors were cautious when trading. Can we expect to see more confidence in the markets going forward? It's hard to tell, as we don't know if we're clear of the recent market volatility yet. But this modest improvement may suggest that investors are keeping a careful eye on how inflation and the economy are impacting the overall markets.
The TD Direct Investing Index (DII) provides data and insights relating to historical self-directed investor activity. By looking at this historical activity, it can help us see how investors reacted to economic and financial market events. This month's DII takes into consideration data from July 1 – July 31. For more information about the DII, read our FAQs.
1 In April 2022 we began a three-month transition of the DII methodology. During this period we slowly adjusted the proxy logic and data modelling to improve the quality of our analysis. This transition was completed for the July 2022 data, at which time we also adjusted the monthly data to include the full calendar month. Accordingly, comparisons between periods with different methodologies may not be as accurate as comparisons between periods of the same methodology.
October 2022: Overall self-directed investor sentiment was bearish. Watch this video for market highlights.

The bear we've been watching the last five months retreated a little but did not go into full hibernation mode. Investor sentiment rose 30 points to -26, still putting sentiment in bearish territory, but with a considerable improvement from September's score of -56. The markets saw major selloffs in all sectors across the board. One of our major index measures, bought versus sold, dropped 18 points to -17, the largest and only decline in our proxies this month. Remember that the DII sentiment score ranges from +100 for most bullish to -100 for most bearish1.
Power to the people
As businesses appeared to pull back spending, from advertising to manufacturing, consumer spending seemed on the rise. In the second and third most heavily traded sectors, Consumer Staples and Healthcare, retail investors pushed Costco (COST), Loblaws (L), Maple Leaf Foods (MFI), Coca-Cola (KO), Canopy (WEED) and Aurora (ACB) in their top bought stocks. Historically, those two sectors show generally consistent performance, even through periods of volatility. Particularly last month, grocers reported fairly good earnings.
How low can you go?
The bottom three sectors were Financials, Consumer Discretionary and Communications. The latter two seemed to be pulled down by tech darlings including Tesla (TSLA), Amazon (AMZN), Google (both GOOG and GOOGL), Netflix (NFLX) and Twitter (TWTR). This is where things get nuanced: while consumer spending remained resilient, business spending went down. This was evident with the more consumer-related technology names such as Apple (AAPL) and Netflix gaining last month, while the big tech names such as Microsoft (MSFT), Google and Amazon showed a slowdown as cloud and advertising growth stalled.
Going somewhere?
Energy was the most popular sector, with Enbridge (ENB) being the top bought, Suncor (SU) and Cenovus (CVE) ranking in both the top 3 bought and sold, and Crescent (CPG) rounding out the top sold. Energy is one of the sectors with many Canadian choices (buy local).
On the flipside, Financials was the least traded sector, even though most major Canadian banks ranked in the top five bought and sold: Bank of Nova Scotia (BNS), TD Bank (TD), CIBC (CM), Royal Bank (RY) and Bank of Montreal (BMO). The Bank of Canada raised the interest rate by 0.5% percent, lower than the anticipated 0.75%, which may have led to a moderate boost in the Canadian market.
Slicing and dicing the data
Looking at trader behaviour, active traders (30+ trades in 3 months) showed the biggest jump last month, rising 24 points for a score of +1. Active traders almost exclusively operated in tech, or tech-like, stocks as Tesla (TSLA), Shopify (SHOP), Amazon (AMZN) and Apple (AAPL) all ranked within their top bought or sold. For comparison, long-term investors (up to 29 trades in 3 months) only rose 6 points to -26. Long-term investors stayed closer to Energy and Financials, with Bank of Nova Scotia (BNS), TD Bank (TD), Enbridge (ENB), Suncor (SU) and Algonquin (AQN) among their top bought or sold.
While Generation Z and Millennials remained the most optimistic, Baby Boomers displayed the biggest jump in sentiment, rising 10 points to -16. Baby Boomers appeared to explore other options outside of their traditional dividend-paying stocks, like energy, and joined Gen Z and Millennials by investing in some growth-oriented stocks, such as Tesla and Shopify.
In conclusion, it’s all about the money
With the U.S. dollar soaring against the Canadian dollar, what does this mean for retail investors? How will the security perform? How will the exchange rate impact profits? This time around, there are so many factors at play – inflation, fear of a recession, interest rates, job growth – that investors seem to be down-playing conversion costs when searching for their next trade idea.
For example, Healthcare ranked as a top performing sector. Because there aren’t many healthcare companies north of the border, investors who wanted pharma, medical equipment, or health-tech companies, had to trade in U.S. dollars. A more broad-based example is how Canadians are rotating from Canadian equities into U.S. equities.
The TD Direct Investing Index (DII) provides data and insights relating to historical self-directed investor activity. By looking at this historical activity, it can help us see how investors reacted to economic and financial market events. This month's DII takes into consideration data from October 1 – 31. For more information about the DII, read our FAQs.
1 In April 2022 we began a three-month transition of the DII methodology. During this period, we slowly adjusted the proxy logic and data modelling to improve the quality of our analysis. This transition was completed for the July 2022 data, at which time we also adjusted the monthly data to include the full calendar month. Accordingly, comparisons between periods with different methodologies may not be as accurate as comparisons between periods of the same methodology.
November 2022: Overall self-directed investor sentiment was bearish. Watch this video for market highlights.

Investors dug in their heels and held their positions last month. But their lack of movement didn't mean they didn't shop around for a good deal or two. Opportunities may have been apparent if you knew where to look.
Investor sentiment was generally consistent between October and November across all sectors and investor types. Our sentiment score saw only a marginal increase of 3 points to -23. Remember that the DII sentiment score ranges from +100 for most bullish to -100 for most bearish1.
Buying the dip
Our bought versus sold proxy jumped 13 points for a score of -4, indicating there were more purchases than sales last month. What were investors buying if overall sentiment was still bearish? Investors were looking for deals.
For example, alternative energy company Algonquin Power (AQN) appeared as one of the 5 most heavily traded companies for all age groups, trader profiles and regions. Its stock was recently pummelled by the markets, but as a high-dividend stock option, its lower price tag may have appeared attractive to some investors. Banks, technology (and tech-like companies) and retail were all sectors that showed some bargains amid dropping stocks prices.
Looking for beaten down companies
Sentiment across industries didn’t change much between October and November. Most investors fell between somewhat neutral to slightly bearish (scores ranged between -3 to 2 across 9 of the 11 sectors). Energy was impacted by rising COVID cases in China, so investors looked for opportunities elsewhere and discovered some in Financials. The sector had a rough year amid the economic uncertainty. Investors took advantage of the sectors' lower prices and moved Financials from one of the bottom three sectors in October to the most traded sector last month, rising 5 points for a score of 2. The most traded financial stocks remained largely the same, with Bank of Nova Scotia (BNS), TD (TD), CIBC (CM) and Royal Bank (RY) ranking among the frequently bought and sold.
Industrials was the second most traded sector, with a score of 2; Air Canada (AC), Bombardier (BBD.B) and Canadian Pacific Railway (CP) ranked as popular bought and sold stocks. Third place was Consumer Staples with a score of 1, unchanged from October as investors opted to stay in the traditionally reliable sector. Grocers like Loblaws (L), Costco (COST) and Maple Leaf (MFI) remained as some of the most heavily traded stocks.
Technology is still making people feel iffy
IT was one of the least traded sectors, with a sentiment score of -1. There was little to no change in its most traded stocks Shopify (SHOP), Apple (AAPL) and software company Lightspeed (LSPD). Shopify made a little bit of a comeback last month, as investors who scooped up the stock during its recent downward trend saw good news when the company reported a pick-up in sales from Black Friday and Cyber Monday. Overall, investment in U.S. equity, which accounts for a large portion of tech stocks, decreased by -0.14%. On the flipside, investment in International Equity increased by 0.23% across all demos. Chinese tech company Alibaba (BABA) experienced a notable rally after China lifted some COVID restrictions and ranked in the top 5 bought stocks for most age groups and investor segments.
Despite last month's Black Friday sales, Consumer Discretionary was also one of the least traded sectors with a score of -8. There was little to no change between its most popular traded stocks Tesla (TSLA), Amazon (AMZN) and Nio Inc. (NIO). Tech-like companies Tesla and Amazon both experienced a rough November as Amazon saw sales slow and company wide layoffs and Elon Musk continued to generate negative press. However, there was an overall increase of trading activity into the sector, as investors saw opportunities in with some of the sector’s beaten down stock prices. Utilities rounded out the bottom three, with Algonquin Power (AQN), Fortis (FTS) and Altagas (ALA) showing little to no change in their status as frequently bought or sold stocks.
The bears may have nestled themselves in for the winter
The generational divide last month was consistent with October. Boomers saw a second month of marginal improvement, although they remained bearish. Gen Z appeared to drop out of traditionally high-yielding companies likes Enbridge and TD and returned to the tech sector for some beaten down, cheaper stocks. Transactions still maintained a mix of tech or tech-like stocks, as Tesla, Amazon, Shopify and Apple continued to rank in every demo. Long-term investors stayed neutral, but active traders dipped into negative sentiment, dropping 8 points to -7, showing even the most frequent traders are exercising caution. With 2023 just around the corner, will investors continue to be cautious as they prepare to close out the year? We'll see next month if the holiday season encourages the bear market to finally go into hibernation.
The TD Direct Investing Index (DII) provides data and insights relating to historical self-directed investor activity. By looking at this historical activity, it can help us see how investors reacted to economic and financial market events. This month's DII takes into consideration data from November 1 – 30. For more information about the DII, read our FAQs.
The TD Direct Investing Index (DII) provides data and insights relating to historical self-directed investor activity. The DII is for informational purposes only. Any information provided through the DII should not be considered an investment recommendation, nor is it an offer, or solicitation of an offer to purchase or sell any investment fund, security or other product. Particular investment, trading, or tax strategies should be evaluated relative to each individual’s objectives. Investors should not take the historical information as an indication, assurance, estimate or forecast of future values or future performance. The DII should not be used as individual financial, legal, investment or tax advice. Please consult your own legal, investment and/or tax advisor. Information provided through the DII is subject to change without notice.
The Toronto-Dominion Bank and/or its subsidiaries or affiliated persons or companies may hold a position in the securities mentioned, including options, futures and other derivative instruments thereon, and may, as principal or agent, buy or sell such securities. They may also make a market in, issue, and participate in an underwriting of such securities.
1 In April 2022 we began a three-month transition of the DII methodology. During this period, we slowly adjusted the proxy logic and data modelling to improve the quality of our analysis. This transition was completed for the July 2022 data, at which time we also adjusted the monthly data to include the full calendar month. Accordingly, comparisons between periods with different methodologies may not be as accurate as comparisons between periods of the same methodology.
December 2022: Overall self-directed investor sentiment was bearish. Watch this video for market highlights.
With holiday spending in full swing, December may not be historically considered a bad month for market movement. But December 2022 marked the lowest investor sentiment score since March 2022 at the onset of the pandemic as investors continued to brace for the likelihood of a recession. The Direct Investment Index (DII) dropped 43 points for a score of -66. Remember that the DII sentiment score ranges from +100 for most bullish to -100 for most bearish. The Toronto Stock Exchange (TSX) was also down 5.5% last month, mirroring this negative sentiment.
The defensive approach
The biggest indicators of bearish trading activity are illustrated in our proxies. Flight to safety , down 16 points to -13, indicated investors traded in lower risk items. Chasing trends, down 20 points to -24, indicated investors bought when share prices were decreasing.
The most heavily traded sectors were traditionally defensive segments Consumer Staples (0) and Healthcare (0). Grocers like Costco (COST), Loblaws (L) and Maple Leaf (MFI) remained the most heavily traded stocks in Consumer Staples. Healthcare saw no major movement except for the addition of biopharmaceutical company Summit Therapies (SMMT) as one of the most traded stocks. Summit recently announced it would license a foreign experimental cancer therapy in a deal worth ~$5 billion, impacting its stock price.
Fewer risk-takers
High-risk sectors IT (-8) and Consumer Discretionary (-12) saw the least trading activity. As consumer spending continued to drop, and an earlier start to holiday sales, retailers continued to face pressure on their profit margins. Also, the tech industry made headlines last month as concerns over the digital cloud business impacted technology-dependant companies, and major tech giants - like Amazon - announced layoffs.
With Canadian banks reporting a less than stellar Q4, sentiment toward Financials fell 10 points to -8, going from one of the most heavily traded sectors in November to the least traded sector in December. The main Canadian banks remained the most traded stocks in the sector.
Boomers were the most bearish toward the markets and dropped 18 points for a sentiment score of -28, with little to no changes in their trading activity. Gen Z and Millennials (-4), Gen X (-16), and Traditionalists (-10) saw more moderate drops (4 to 8 points) by comparison. Long-term investors also felt very bearish, and sentiment declined 30 points for a score of -45.
Did bargain hunters find anything?
Investors continued to look for bargains and sales where they could find them. Tesla (TSLA), a beaten down stock over much of 2022, continued to be a heavily traded stock by all demos and investor types. Boomers, Traditionalists, and Long-term Investors appeared to take advantage of the changing price tag on Canadian energy company Algonquin Power (AQN), another stock that got hammered last year. Gen Z and Millennials and Gen X continued to favour the up and down Shopify (SHOP). CIBC (CM), known for its comparably higher yield dividends, was a heavily bought stock across the country and among all age groups and active traders last month. With a low Q4 performance impacting the company's stock price, it likely appeared as an attractive buy to investors.
The “safe” mindset
Overall, it appears that buying the dip and selling high, and moving away from riskier investments and into safer, more defensive sectors are how many investors played the markets last month. With many Canadians expecting a potential recession at the start of 2023, next month we'll see what the DII sentiment score tells us about how investors felt trading at the start of the new year.
The TD Direct Investing Index (DII) provides data and insights relating to historical self-directed investor activity. By looking at this historical activity, it can help us see how investors reacted to economic and financial market events. This month's DII takes into consideration data from December 1 – 31. For more information about the DII, read our FAQs.
The TD Direct Investing Index (DII) provides data and insights relating to historical self-directed investor activity. The DII is for informational purposes only. Any information provided through the DII should not be considered an investment recommendation, nor is it an offer, or solicitation of an offer to purchase or sell any investment fund, security or other product. Particular investment, trading, or tax strategies should be evaluated relative to each individual’s objectives. Investors should not take the historical information as an indication, assurance, estimate or forecast of future values or future performance. The DII should not be used as individual financial, legal, investment or tax advice. Please consult your own legal, investment and/or tax advisor. Information provided through the DII is subject to change without notice. The Toronto-Dominion Bank and/or its subsidiaries or affiliated persons or companies may hold a position in the securities mentioned, including options, futures and other derivative instruments thereon, and may, as principal or agent, buy or sell such securities. They may also make a market in, issue, and participate in an underwriting of such securities.
1 In April 2022 we began a three-month transition of the DII methodology. During this period, we slowly adjusted the proxy logic and data modelling to improve the quality of our analysis. This transition was completed for the July 2022 data, at which time we also adjusted the monthly data to include the full calendar month. Accordingly, comparisons between periods with different methodologies may not be as accurate as comparisons between periods of the same methodology.
January 2023: Overall self-directed investor sentiment was bullish. Watch this video for market highlights.

Investor sentiment did a 180 degree turn in January and increased across every sector, demographic, trader type, and region, and headed into bullish territory for the first time in 9 months. Our TD Direct Investing Index (DII) fell into very bearish territory in December with a sentiment score of -66, but then spiked up 72 points in January for a score of +6. Remember that the DII sentiment score ranges from +100 for most bullish to -100 for most bearish1.
The final score wasn't too far of a jump into bullish territory, but compared against December, there were substantial increases in trading activity by all type of investors.
Taking care of (risky) business
We needed to look at the proxies that analyze investor action to better understand why sentiment increased in January. Chasing Trends measured how many investors bought stocks on a rising or falling market. Down -20 points in December for a score of -24, last month saw sentiment jump 38 points for a score of +14, indicating more investors bought as share prices rose. Flight to Safety measured how much investors pulled back into safer, less risky investments. Down 16 points in December for a score of -13, January saw sentiment jump 20 points for a score of +7, indicating many investors traded in higher risk assets.
Investors increased trading activity and leaned more into riskier securities, such as equities, on a rising market, over the less risky cash, bonds, and fixed income markets. It appeared anticipation that inflation would "decline significantly" was a key driver of that equity market rally in January. Similar investor sentiment was seen in other places too; the Toronto Stock Exchange (TSX) return was up 6% in January and the start of the year was also a pretty good month for S&P.
Calling IT
January's most heavily traded sectors showed movement into riskier investments. Technology (+4) saw the least trading activity in December but jumped to one of the most traded sectors in last month. Shopify (SHOP), Apple (AAPL) and Microsoft (MSFT) all ranked within the most heavily traded companies. A new company to crack the heavily traded list, Microsoft made headlines last month with a strong quarter and its announcement of a deal with OpenAI.
On the flipside, Healthcare (+1) saw a lot of activity in December but dropped to one of the least traded in sectors for January. Financials (+4) and Industrials (+3) round out the three most heavily traded sectors, and Consumer Discretionary (+1) and Utilities (+1) – both also traditionally defensive sectors – round out the least traded in. Consumer Discretionary also reflected investor interest in the riskier Tech industry, as tech-like companies, such as Tesla (TSLA), Amazon (AMZN) and Alibaba (BABA), ranked as its heavily traded stocks.
Forging ahead
As with the sectors, sentiment across every investor-type also increased last month. Gen X (up 12 points to -4) and Boomers (up 27 points to -1) remained slightly bearish, but Gen Z & Millennials (up 7 points to +7), and Traditionalists (up 16 points to +6) were more bullish on the markets. This aligned with the sector activity, as younger investors tend to lean more into Technology while older investors tend to lean into Financials. Active Traders (up 29 points to +8) were more optimistic than Long Term Investors (up 43 points to -2) but both investor types made significant jumps in sentiment.
January also revealed that investors moved out of Canadian Equity and Canadian Fixed Income and into U.S. Equities. That activity aligns with the sector movement, as both the heavily traded IT and Consumer Discretionary include a significant amount of U.S. stocks. This also meshes with our Flight to Safety proxy as equities are generally considered risker investments.
Whether or not the Government of Canada can say if we're in a recession didn’t appear to deter investor activity last month. Some may see that activity as a great way to start the year, but we'll have to wait until next month to see how 2023 is holding up two months in.
The TD Direct Investing Index (DII) provides data and insights relating to historical self-directed investor activity. By looking at this historical activity, it can help us see how investors reacted to economic and financial market events. This month's DII takes into consideration data from January 1 – 31. For more information about the DII, read our FAQs.
The TD Direct Investing Index (DII) provides data and insights relating to historical self-directed investor activity. The DII is for informational purposes only. Any information provided through the DII should not be considered an investment recommendation, nor is it an offer, or solicitation of an offer to purchase or sell any investment fund, security or other product. Particular investment, trading, or tax strategies should be evaluated relative to each individual’s objectives. Investors should not take the historical information as an indication, assurance, estimate or forecast of future values or future performance. The DII should not be used as individual financial, legal, investment or tax advice. Please consult your own legal, investment and/or tax advisor. Information provided through the DII is subject to change without notice. The Toronto-Dominion Bank and/or its subsidiaries or affiliated persons or companies may hold a position in the securities mentioned, including options, futures and other derivative instruments thereon, and may, as principal or agent, buy or sell such securities. They may also make a market in, issue, and participate in an underwriting of such securities.
1 In April 2022 we began a three-month transition of the DII methodology. During this period, we slowly adjusted the proxy logic and data modelling to improve the quality of our analysis. This transition was completed for the July 2022 data, at which time we also adjusted the monthly data to include the full calendar month. Accordingly, comparisons between periods with different methodologies may not be as accurate as comparisons between periods of the same methodology.
February 2023: Overall self-directed investor sentiment was bearish. Watch this video for market highlights.

After its first sighting in 9 months, the bull quickly retreated as a bear crept back into the picture in February as investor sentiment fell -15 points from +6 to -8. Trading activity indicated more caution toward the markets; while investors still traded, they played it safe, and more defensively, with less risks and bought at lower prices. Remember that the DII sentiment score ranges from +100 for most bullish to -100 for most bearish1.
But enough investors took a less cautious approach to the markets that helped cushion the drop in investor sentiment. Whatever your approach was, despite the bearish score, investors bought more than they sold last month.
Some bought high, some bought low
But two different buying trends emerged; some investors bought on a declining market while others bought at 52-week highs. Our Chasing Trends proxy fell 22 points from +14 to -8 indicating fewer investors bought on a rising share price, and instead placed trades at cheaper prices. Our Flight to Safety proxy fell 12 points from +7 to -5, indicating investors mostly traded in lower risk securities such as cash and cash equivalents, bonds and fixed income.
On the flipside, there was enough activity from investors who placed trades on a rolling 52-week high to push our Bought at Extremes proxy up 9 points from -7 to +2. A rolling 52-week high means the highest price the security traded at a full year back from that date. Gen Z & Millennials and Active Traders were slightly more bullish, while Boomers and Long-Term Investors were more bearish with their trading activity.
Even though investors definitely placed trades last month – some at the highest prices in a year - there remained an overall bearish sentiment due to more people pulling back into safer, less risky investments and less people willing to place a trade when prices were going up that ultimately drove our DII score down.
Tech still at the top
Sector activity in February pretty much mimicked that of January. Tech was down 2 points from +4 to +2, and Industrials was down 1 point from +3 to +2; both remained the most heavily traded sectors. They were joined by Consumer Discretionary, down 1 point from +1 to 0. Investors remained focused on tech and tech-like stocks as Shopify (SHOP), Apple (AAPL), Microsoft (MSFT), Tesla (TSLA), and Amazon (AMZN) were some of the most heavily traded companies again in February.
As an asset class, U.S. Equities remained highly active last month, which aligns with that bullish take on technology, as the U.S. generally offers more choices for Canadians in Technology and Consumer Discretionary sectors. However, the most notable asset rotation was in Cash & Cash Equivalents and out of Canadian Equities across all demos and investor types, further enforcing our Flight to Safety score that indicates more investors opted for lower risk opportunities.
Losing Energy
Energy was the only sector that saw its sentiment score change by more than 4 points. The industry saw weaker investor sentiment throughout 2022, and February seemed to follow suit as the sector fell 7 points from +2 to -5. It's notable to mention that in addition to the more routinely ranked natural gas and oil companies, such as Suncor (SU), Cenovus (CVE) and Baytex (BTE), defensive stocks - like pipeline companies Enbridge (ENB) and TC Pipelines (TRP) - were also heavily purchased in February. Healthcare and Utilities remained as the other two least traded sectors, both down 2 points from +1 to -1.
Bull & bear battling it out
So, while investor sentiment was mostly bearish last month, the scores indicate that not all investors felt that way, with some positive investor sentiment in certain areas. But not enough to convince the bull to stick around.
The TD Direct Investing Index (DII) provides data and insights relating to historical self-directed investor activity. By looking at this historical activity, it can help us see how investors reacted to economic and financial market events. This month's DII takes into consideration data from February 1 – 28. For more information about the DII, read our FAQs.
The TD Direct Investing Index (DII) provides data and insights relating to historical self-directed investor activity. The DII is for informational purposes only. Any information provided through the DII should not be considered an investment recommendation, nor is it an offer, or solicitation of an offer to purchase or sell any investment fund, security or other product. Particular investment, trading, or tax strategies should be evaluated relative to each individual’s objectives. Investors should not take the historical information as an indication, assurance, estimate or forecast of future values or future performance. The DII should not be used as individual financial, legal, investment or tax advice. Please consult your own legal, investment and/or tax advisor. Information provided through the DII is subject to change without notice. The Toronto-Dominion Bank and/or its subsidiaries or affiliated persons or companies may hold a position in the securities mentioned, including options, futures and other derivative instruments thereon, and may, as principal or agent, buy or sell such securities. They may also make a market in, issue, and participate in an underwriting of such securities.
1 In April 2022 we began a three-month transition of the DII methodology. During this period, we slowly adjusted the proxy logic and data modelling to improve the quality of our analysis. This transition was completed for the July 2022 data, at which time we also adjusted the monthly data to include the full calendar month. Accordingly, comparisons between periods with different methodologies may not be as accurate as comparisons between periods of the same methodology.
March 2023: Overall self-directed investor sentiment was bearish. Watch this video for market highlights.
Sentiment ventured further into bearish territory as the TD Directing Investing Index score fell 12 points from -8 to -20 last month. While safety was still the name of the game for investors, the fallout of Silicon Valley Bank (SVB) in the U.S. was visible in market activity as the financial sector suffered a hit. Remember that the DII sentiment score ranges from +100 for most bullish to -100 for most bearish1.
Buying the dip
Our Bought versus Sold proxy remained unchanged with a score of 3, and indicated investors bought more than they sold in March. But where they bought had changed. Our Bought at Extremes proxy fell heavily into bearish territory with a drop of 18 points from 2 to -16. This indicates that investors bought at the bottom of the market on stocks that reached 52-week lows.
Fallout of SVB
The fallout from the collapse of SVB was clearly visible in the markets. Despite the financial sector trending on the cheaper side in March, nobody seemed keen on the industry as Financials was the least traded in sector last month, dropping 11 points from 0 to -11. The most heavily traded stocks were Toronto-Dominion Bank (TD), Bank of Nova Scotia (BNS), Canadian Imperial Bank of Commerce (CM) and Royal Bank of Canada (RBC).
This trend wasn't just contained to the U.S.; other comparable events also impacted the financial sector, such as the bailout of Credit Suisse. Traditionalists have historically focused on the financial sector, so it's no surprise they were the most bearish on Financials.
Investors weren't just pessimistic toward Financials; Energy felt the bearish sentiment too as the sector remained one of the least traded sectors again for another month with a score of -5. Oil was hit particularly hard as the most heavily sold stocks were Suncor (SU), Enbridge (ENB) and Cenovus (CVE), Canadian Natural Resources (CNQ) and Crescent Point (CPG); all companies involved with oil production.
Tech Haven
Some investors saw opportunities with growth stocks in the Technology sector, which experienced a modest bump in activity. The sector remained the most heavily traded in for a second month with a score of +3, followed by Materials and Communications, both with a score of +1. The most heavily bought tech stocks were Shopify (SHOP), Nvidia (NVDA) and Hut 8 (HUT) and the most heavily sold stocks were Shopify (SHOP), Nvidia (NVDA), and Apple Inc (AAPL).
Boomers were the most bearish overall, falling 5 points from -8 to -13. There was very little sentiment change from Gen Z and Millennials, falling 1 point to +1 and Gen X, falling 2 points to -2.
The Ripple Effect
As a result of the ripple effect of recent bank failures, investors appeared to veer away from Financials, and also Energy, and sought safe havens where they could find any. As Energy is so often viewed as a comparable barometer of the health of the economy, the fact that its still in bearish territory aligns with the DII's overall bearish sentiment score. Investors still felt bearish amid an economy that kept everyone guessing on what it was going to do next.
The TD Direct Investing Index (DII) provides data and insights relating to historical self-directed investor activity. By looking at this historical activity, it can help us see how investors reacted to economic and financial market events. This month's DII takes into consideration data from March 1 – 31. For more information about the DII, read our FAQs.
The TD Direct Investing Index (DII) provides data and insights relating to historical self-directed investor activity. The DII is for informational purposes only. Any information provided through the DII should not be considered an investment recommendation, nor is it an offer, or solicitation of an offer to purchase or sell any investment fund, security or other product. Particular investment, trading, or tax strategies should be evaluated relative to each individual’s objectives. Investors should not take the historical information as an indication, assurance, estimate or forecast of future values or future performance. The DII should not be used as individual financial, legal, investment or tax advice. Please consult your own legal, investment and/or tax advisor. Information provided through the DII is subject to change without notice. The Toronto-Dominion Bank and/or its subsidiaries or affiliated persons or companies may hold a position in the securities mentioned, including options, futures and other derivative instruments thereon, and may, as principal or agent, buy or sell such securities. They may also make a market in, issue, and participate in an underwriting of such securities.
1 In April 2022 we began a three-month transition of the DII methodology. During this period, we slowly adjusted the proxy logic and data modelling to improve the quality of our analysis. This transition was completed for the July 2022 data, at which time we also adjusted the monthly data to include the full calendar month. Accordingly, comparisons between periods with different methodologies may not be as accurate as comparisons between periods of the same methodology.
April 2023: Overall self-directed investor sentiment was bearish. Watch this video for market highlights.

After investor sentiment got knocked down 12 points to -20 in March, sentiment appeared to get back up again as the TD Direct Investing Index (DII) was up again by 9 points, from -20 to -11. The TSX return was also up 2.7% last month, echoing this behaviour. Remember that the DII sentiment score ranges from +100 for most bullish to -100 for most bearish1.
April bore witness to several better-than-expected Q1 results, which helped offset renewed fears over the U.S. regional banking sector and signs of a slowing U.S. economy. The resulting impact contributed to this slightly less bearish, less pessimistic, mildly positive change in investor sentiment.
Bought at the top
The mild positivity also lined-up with more stocks rolling into new 52-week highs, as our Bought at Extremes proxy increased 16 points from -16 to a neutral 0. This indicates some investors who felt slightly less bearish may have also bought at the top of the market on a rolling 52-week high price.
However, investors were still cautious on the markets as a whole and sold more than bought last month as our Bought vs Sold proxy dropped 11 points from +3 to -8.
Tech still top of mind
Investors appeared to have had their sights set on Tech, with expectations of lower rates, and Financials and the hopes of bargain hunting, as those sectors saw the most noteworthy activity last month.
Technology saw positive news in April as companies like Alphabet, Amazon and Microsoft reported their Q1 earnings, and rose 3 points to +5. It's no surprise that tech, and tech-like stocks, such as Shopify (SHOP), C3.ai Inc. (AI), Microsoft (MSFT), Apple (AAPL), Nvidia (NVDA), Marathon Digital (MARA), Tesla (TSLA), Amazon (AMZN) and Alibaba (BABA) were some of the most heavily traded companies last month. C3.ai Inc. marks the first time an artificial intelligence company has cracked the top five heavily traded stocks in the tech sector.
The biggest sector movement was in Financials, jumping 12 points from -11 to +1. After a market dip in March, some investors found opportunities in the fragile sector after the U.S. regional bank crisis and the collapse in a handful of names, including Silicon Valley Bank, First Republic and Silvergate. Toronto-Dominion Bank (TD), Bank of Montreal (BMO) and Bank of Nova Scotia (BNS) were among the most heavily traded companies in the sector.
Always seems to be in demand
Consumer Staples rounded out the top three heavily traded sectors last month and rose 1 point to +2. Costco (COST), Loblaws (L) and Coca-Cola (KO) ranked as some of the most heavily traded stocks. The sector has generally been regarded as a less risker investment compared to others, so it's no surprise that some investors are continually drawn to it during periods of market uncertainty, such as slowing earnings momentum, sticky inflation and the debt ceiling. On the flipside, Consumer Discretionary was one of the least traded sectors last month, joined by Energy and Real Estate.
Who were the most optimistic?
Boomers held the most optimistic increase across the demos, jumping 5 points from -13 to -8. But they were still the most bearish by comparison as there were minimal sentiment changes among the other demos. Gen Z and Millennials continue to be the most optimistic maintaining their score of +1. Both Long-term and Active traders moved toward a more positive sentiment. However, after increasing 4 points, Long-term traders were still more pessimistic with a final score of -15. Active traders jumped 5 points for a score of +4.
So, while there was some mild optimism after a positive Q1 earnings season, and with banks on the rebound, it appeared that enough investors took very cautious – and still very bearish – actions to move the sentiment needle toward a less pessimistic outlook.
The TD Direct Investing Index (DII) provides data and insights relating to historical self-directed investor activity. By looking at this historical activity, it can help us see how investors reacted to economic and financial market events. This month's DII takes into consideration data from April 1 – 30. For more information about the DII, read our FAQs.
The TD Direct Investing Index (DII) provides data and insights relating to historical self-directed investor activity. The DII is for informational purposes only. Any information provided through the DII should not be considered an investment recommendation, nor is it an offer, or solicitation of an offer to purchase or sell any investment fund, security or other product. Particular investment, trading, or tax strategies should be evaluated relative to each individual’s objectives. Investors should not take the historical information as an indication, assurance, estimate or forecast of future values or future performance. The DII should not be used as individual financial, legal, investment or tax advice. Please consult your own legal, investment and/or tax advisor. Information provided through the DII is subject to change without notice. The Toronto-Dominion Bank and/or its subsidiaries or affiliated persons or companies may hold a position in the securities mentioned, including options, futures and other derivative instruments thereon, and may, as principal or agent, buy or sell such securities. They may also make a market in, issue, and participate in an underwriting of such securities.
1 In April 2022 we began a three-month transition of the DII methodology. During this period, we slowly adjusted the proxy logic and data modelling to improve the quality of our analysis. This transition was completed for the July 2022 data, at which time we also adjusted the monthly data to include the full calendar month. Accordingly, comparisons between periods with different methodologies may not be as accurate as comparisons between periods of the same methodology.
May 2023: Overall self-directed investor sentiment was bearish. Watch this video for market highlights.
June 2023: Overall self-directed investor sentiment was bullish. Watch this video for market highlights.

July 2023: Overall self-directed investor sentiment was bullish. Watch this video for market highlights.
August 2023: Overall self-directed investor sentiment was bearish. Watch this video for market highlights.

September 2023: Overall self-directed investor sentiment was bearish. Watch this video for market highlights.

October 2023: Overall self-directed investor sentiment was bearish. Watch this video for market highlights.

November 2023: Overall self-directed investor sentiment was bullish. Watch this video for market highlights.

December 2023: Overall self-directed investor sentiment was bullish. Watch this video for market highlights.

January 2024: Overall self-directed investor sentiment was bullish. Watch this video for market highlights.

February 2024: Overall self-directed investor sentiment was bullish. Watch this video for market highlights.
March 2024: Overall self-directed investor sentiment was bullish. Watch this video for market highlights.

Most popular securities (self-directed investors)
Last month's trend (self-directed investors)
Asset allocation and sector rotation refer to the average month-to-month changes in investments inside Direct Investors' portfolios. It is not included in the DII sentiment score. The data tracks the averages of how much traders changed their investments in each asset type or industry sector in the previous month.
This data can help investors to observe additional market trends and investor behaviours as it's based on where traders decided to invest their money rather than looking at the most heavily traded stocks. Learn more about asset classes and sectors in our FAQ.
The asset allocation comparison methodology has changed as of March 2024. We implemented a process to improve the asset allocation comparison methodology by adjusting the data modelling. Comparisons between asset allocation data prior to this change and after this change may produce different comparison results than between periods with the same methodology.
Invest with confidence
Stay on top of the market with TD Direct Investing.