We have diversification, scale, and a unique footprint
$14.3 billion
2021 Reported Earnings
$14.6 billion
2021 Adjusted Earnings1
2,209
Retail locations in North America
15
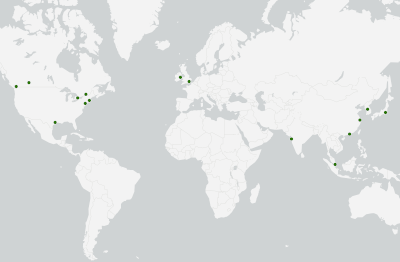
TD Securities offices worldwide

Safest Bank in North America
according to Global Finance3
TD’S PREMIUM RETAIL EARNINGS MIX2
green bar represents Canadian Retail
Canadian Retail
dark green bar represents Reported U.S. Retail
gray green bar represents Reported Wholesale
dark green bar represents Reported U.S. Retail
gray green bar represents Reported Wholesale
90% Retail
10% Wholesale
We have a strong balance sheet
$1.7 trillion
Assets
15.2%
CET1 Ratio4
$1.1 trillion
Deposits
126%
Liquidity Coverage Ratio4
3.02%
Return on Risk-Weighted Assets5
(Financial information as at October 31, 2021)
We have a deep commitment to sustaining the trust of those we serve
Three core principles of our Risk Appetite
We take risks required to build our business, but only if those risks:
- Fit our business strategy and can be understood and managed
- Do not expose the enterprise to any significant single loss events; we don’t “bet the bank” on any single acquisition, business or product
- Do not risk harming the TD brand
1 Adjusted results are non-GAAP financial measures. Refer to “Non-GAAP and Other Financial Measures” in the “Financial Results Overview” section in the 2021 Management’s Discussion & Analysis (MD&A).
2 Reported basis excluding Corporate segment. Numbers may not add due to rounding.
3 Global Finance’s 30th annual ranking of the World’s Safest Banks published on September 15, 2021.
4 These measures have been calculated in accordance with OSFI’s Capital Adequacy Requirements and Liquidity Adequacy Requirements guidelines.
5 For additional information about this metric, refer to the Glossary in the 2021 MD&A.
2021 Snapshot
Performance indicators focus effort, communicate our priorities, and benchmark our results against key elements of our proven business model. Results in 2021 were affected by the COVID-19 pandemic.
| Performance Indicators6 | 2021 Results6, 8 (on an adjusted basis) |
|---|---|
|
|
NET INCOME
available to common shareholders
(millions of Canadian dollars)
light green bar represents Reported
Reported
green bar represents Adjusted
Adjusted8
TD’s 5-year CAGR
9.8% Reported
9.8% Adjusted8
DILUTED EARNINGS PER SHARE (EPS)
(Canadian dollars)
light green bar represents Reported
Reported
green bar represents Adjusted
Adjusted8
TD’s 5-year CAGR
10.6% Reported
10.2% Adjusted8
RETURN ON COMMON EQUITY9
(percent)
light green bar represents Reported
Reported
green bar represents Adjusted
Adjusted8
TD’s 2021 ROE
15.5% Reported
15.9% Adjusted8
DIVIDEND HISTORY
165-year
Continuous Dividend History
3.9%
2021 Dividend Yield9
12.4%
Total Shareholder Return9
(5-year CAGR11)
6 Performance indicators that include an earnings component are based on TD’s full-year adjusted results (except as noted).
7 Revenue is net of insurance claims and related expenses.
8 Adjusted results are non-GAAP financial measures. Refer to “Non-GAAP and Other Financial Measures” in the “Financial Results Overview” section in the 2021 MD&A.
9 For additional information about this metric, refer to the Glossary in the 2021 MD&A.
10 25-year CAGR is the compound annual growth rate calculated from 1996 to 2021.
11 5-year CAGR is the compound annual growth rate calculated from 2016 to 2021.