Proven business model
Deliver consistent earnings growth, underpinned by a strong risk culture
Our diversified, retail-focused business model and North American scale are powerful enablers - delivering strong results today, while allowing us to reinvest in our competitive advantages, as we build and transform our businesses to meet our needs today and in the future. Our approach to managing risk is evident in strong balance sheet metrics and reflects our commitment to sustaining the trust of those we serve.
TD’S PREMIUM RETAIL EARNINGS MIX1
TD’s premium earnings mix reflects our North American retail focus – lower-risk businesses with stable, consistent earnings
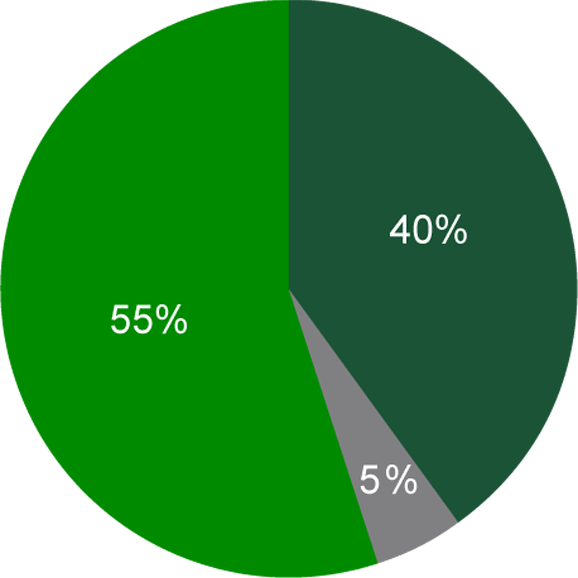
 Canadian Retail
- U.S. Retail
- Wholesale
- 95% Retail
- 5% Wholesale
Record Reported Earnings of $11.7 billion in 2019
$12.5 billion Adjusted earnings
Total Shareholder Return2
(5-year CAGR)
10.3%
7.7% Canadian peers
DIVIDEND HISTORY
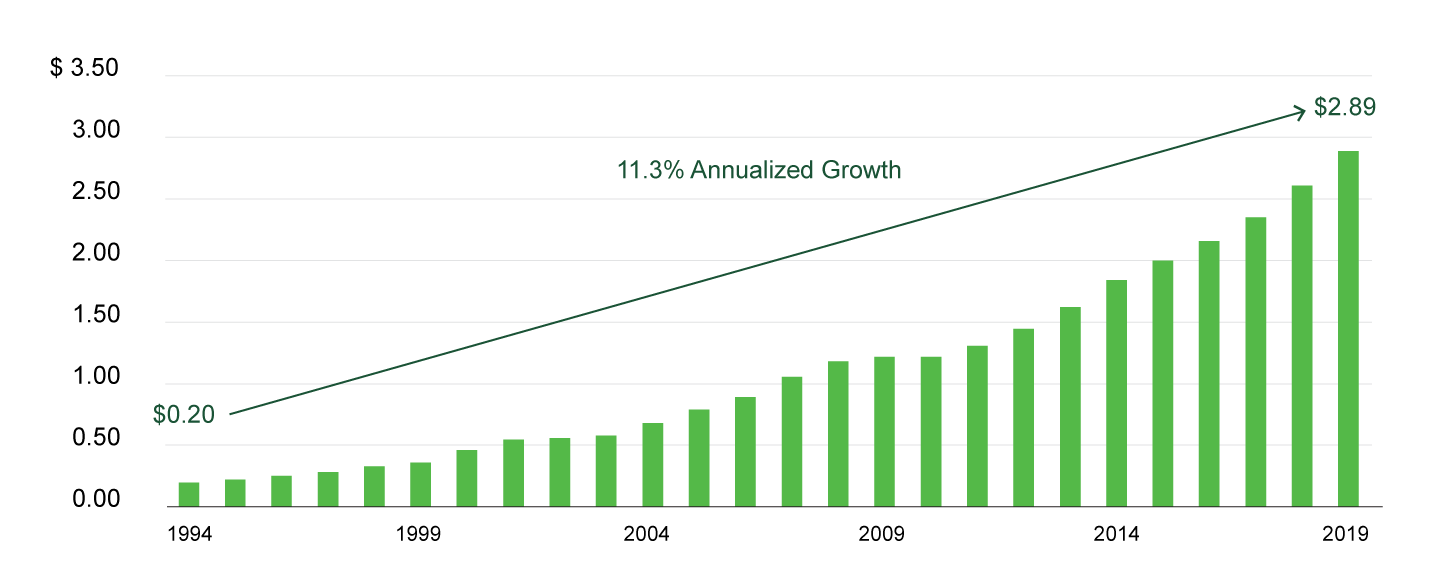
163-year
Continuous Dividend History
11.3%
Dividend Growth3
(25-year CAGR)
3.9%
2019 Dividend Yield
2019 Snapshot
Net Income
available to common shareholders
(millions of Canadian dollars)
Reported
Adjusted
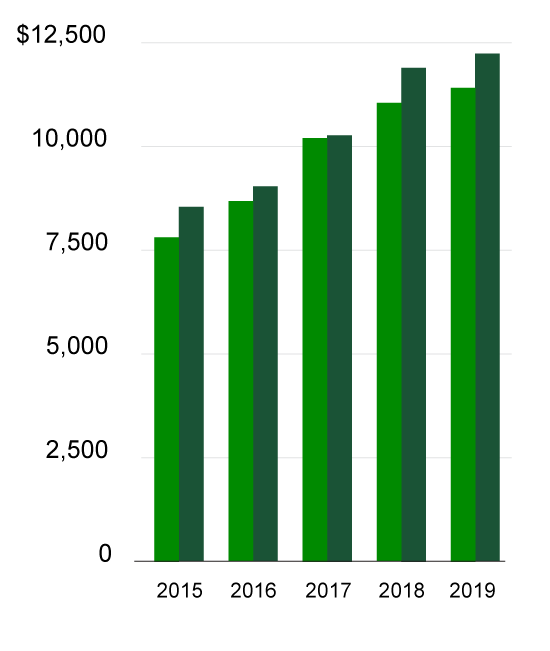
TD's 5-year CAGR
8.4% Reported
9.2% Adjusted
Diluted Earnings Per Share
(Canadian dollars)
Reported
Adjusted

TD's 5-year CAGR
8.6% Reported
9.4% Adjusted
Return on Common Equity
(percent)
Reported
Adjusted
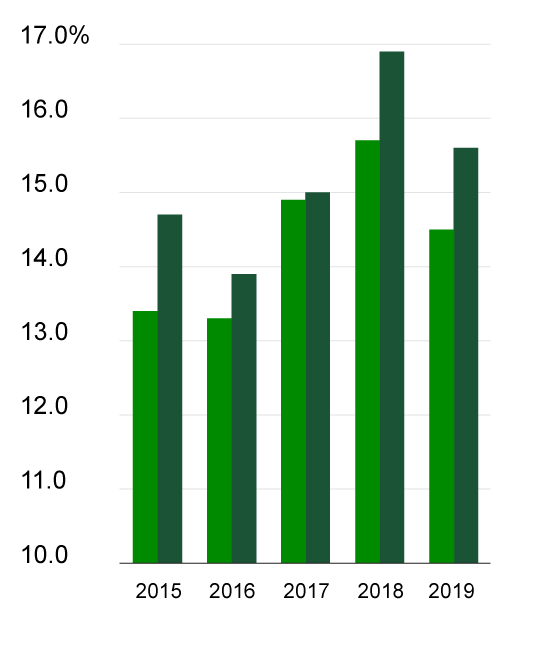
TD's 2019 ROE
14.5% Reported
15.6% Adjusted
Performance indicators communicate our priorities, focus effort and benchmark our results against key elements of our proven business model.
| 2019 performance indicators | Results4 |
|---|---|
|
|
Assets $1.4 trillion
Up 6.0% YoY
Deposits $0.9 trillion
Up 4.2% YoY
Return on Risk-Weighted Assets
2.73%
CET1 Ratio
12.1%
1 Reported basis excluding Corporate segment.
2 5-year CAGR is the compound annual growth rate calculated from 2014 to 2019. Source: Bloomberg. Canadian peers include Bank of Montreal, Canadian Imperial Bank of Commerce, Royal Bank of Canada, and Scotiabank.
3 25-year CAGR is the compound annual growth rate calculated from 1994 to 2019.
4 Performance indicators that include an earnings component are based on TD’s full-year adjusted results (except as noted) as explained on page 15.
5 Revenue is net of insurance claims and related expenses.
Refer to footnotes on page 15 of the complete annual report (available here) for information on how the results on this page are calculated.
back to top